100+ Server Statistics for 2026
Worldwide server spending grew 30.7% year over year in Q1 2026, while unit shipments rose just 3.3%. The gap points to higher spending per system as AI accelerators, memory, networking, storage, and cooling become larger parts of the server bill.
This collection presents 140 server statistics covering market growth, AI systems, vendor revenue, cloud workloads, containers, web server software, hyperscale capacity, storage, supercomputing, energy, outages, and security. Each numbered item links to its source.
The figures can support server budgets, capacity plans, architecture reviews, procurement decisions, risk models, and editorial research. Readers who need hosting-specific data can use Hyperconvergence’s web hosting statistics companion article.
Server Statistics at a Glance
- Server market revenue is forecast to reach $647.0 billion in 2026.
- AI infrastructure spending is forecast to reach $497 billion in 2026.
- Public cloud infrastructure revenue reached $128.6 billion in Q1 2026.
- Hyperscale operators controlled 48% of global data center capacity at the end of 2025.
- Data center electricity use is projected to reach about 950 TWh in 2030.
Global Server Market Size and Spending Statistics
- Worldwide server spending rose 30.7% year over year in Q1 2026. IDC
- Worldwide server unit shipments grew 3.3% year over year in Q1 2026. IDC
- IDC expects worldwide server revenue to post a 25.1% compound annual growth rate through 2030. IDC
- The worldwide server market reached $453.53 billion in 2025, up 78.2% from 2024. IDC
- X86 server revenue reached $298.56 billion in 2025, a 46.1% annual increase. IDC
- Non-x86 server revenue reached $154.97 billion in 2025, up 209.3% in one year. IDC
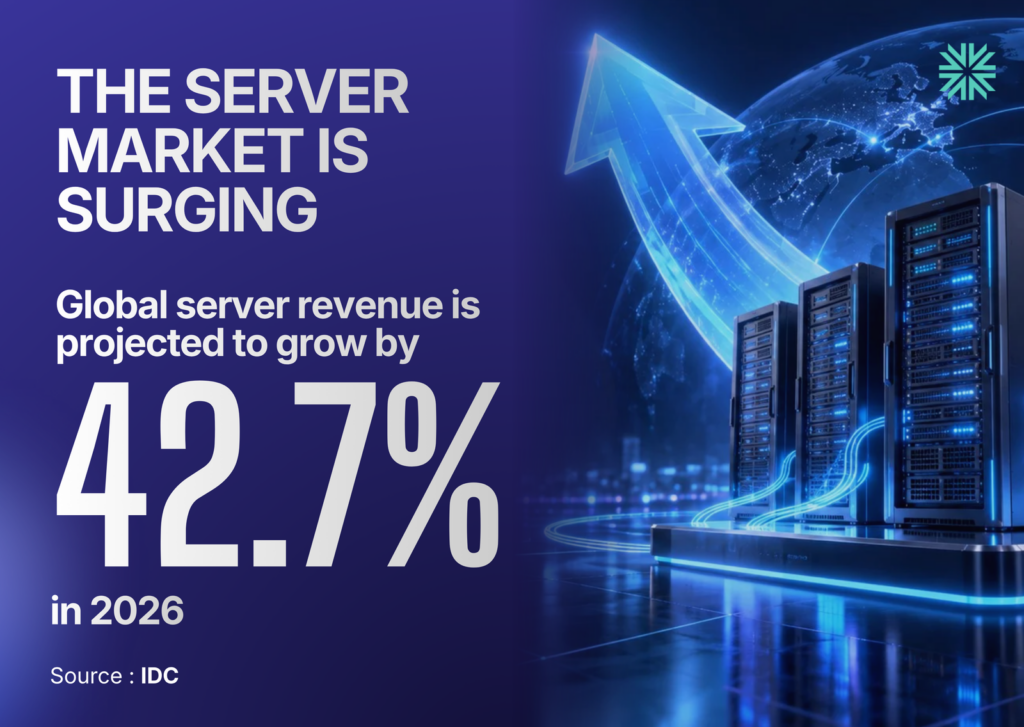
- IDC forecasts total server revenue of $647.00 billion for 2026, a 42.7% annual gain. IDC
- X86 server revenue is forecast to reach $335.93 billion in 2026, up 12.5%. IDC
- Non-x86 server revenue is forecast to reach $311.07 billion in 2026, up 100.7%. IDC
- Total server revenue is forecast to reach $930.56 billion in 2027, a 43.8% annual increase. IDC
- Worldwide data center systems spending is forecast to reach $822 billion in 2026, up 62.5%. Gartner
- Infrastructure as a service spending is forecast to reach $287 billion in 2026, up 29.3%. Gartner
Server buyers can compare deployment models in Hyperconvergence’s cloud server vs. physical server guide.
AI Server and Accelerated Computing Statistics
- Global AI infrastructure spending reached $89.7 billion in Q1 2026, up 33.1% year over year. IDC
- AI infrastructure spending reached $153 billion in 2024, a 107.6% annual increase. IDC
- Full-year AI infrastructure spending reached $318 billion in 2025. IDC
- IDC forecasts $497 billion in AI infrastructure spending for 2026, about 56% more than in 2025. IDC
- AI infrastructure spending is forecast to pass $1.08 trillion in 2029. IDC
- AI infrastructure spending is forecast to reach $1.21 trillion in 2030, with a five-year growth rate near 30%. IDC
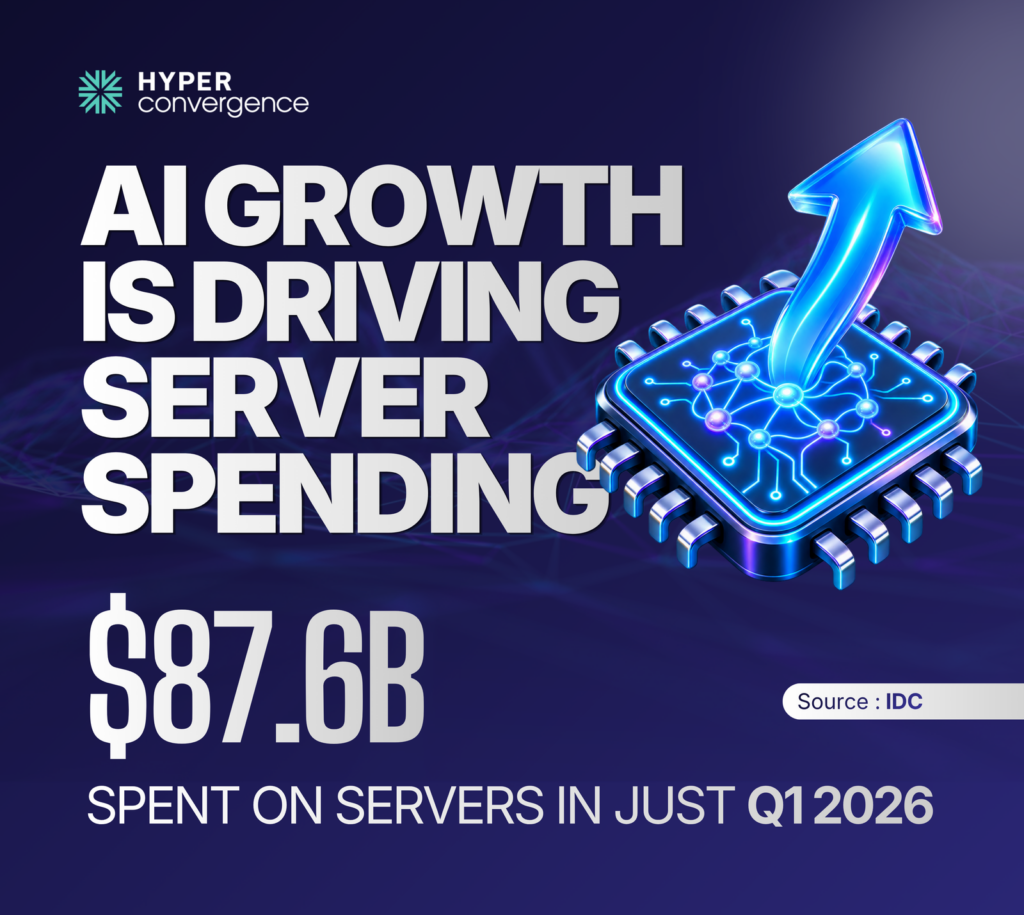
- Servers accounted for $87.6 billion, or 97.6%, of AI infrastructure spending in Q1 2026. IDC
- Storage accounted for $2.2 billion, or 2.4%, of AI infrastructure spending in Q1 2026. IDC
- Non-x86 Arm accelerated server spending reached $53.0 billion in Q1 2026. IDC
- X86 accelerated server spending reached $34.6 billion in Q1 2026. IDC
- US AI infrastructure spending reached $67.9 billion in Q1 2026, equal to 75.7% of the global total. IDC
- China’s AI infrastructure spending reached $7.8 billion in Q1 2026, equal to 8.7% of the global total. IDC
- Middle East and Africa AI infrastructure spending reached $1.1 billion in Q1 2026, up 233% year over year. IDC
- Asia-Pacific excluding Japan and China spent $5.8 billion on AI infrastructure in Q1 2026, up 62%. IDC
- Global AI server shipments are forecast to grow nearly 31% in 2026. TrendForce
- Nine major cloud service providers are forecast to spend more than $886.7 billion in capital during 2026, an annual increase near 90%. TrendForce
- The same nine cloud providers are forecast to spend about $1.3 trillion in 2027, nearly 50% more than in 2026. TrendForce
Server Vendor Revenue Statistics
Vendor fiscal periods and reporting categories differ, so these figures work best as company-level demand signals rather than direct market-share comparisons.
- Dell’s Infrastructure Solutions Group reported $29.0 billion in Q1 fiscal 2027 revenue, up 181% year over year. Dell Technologies
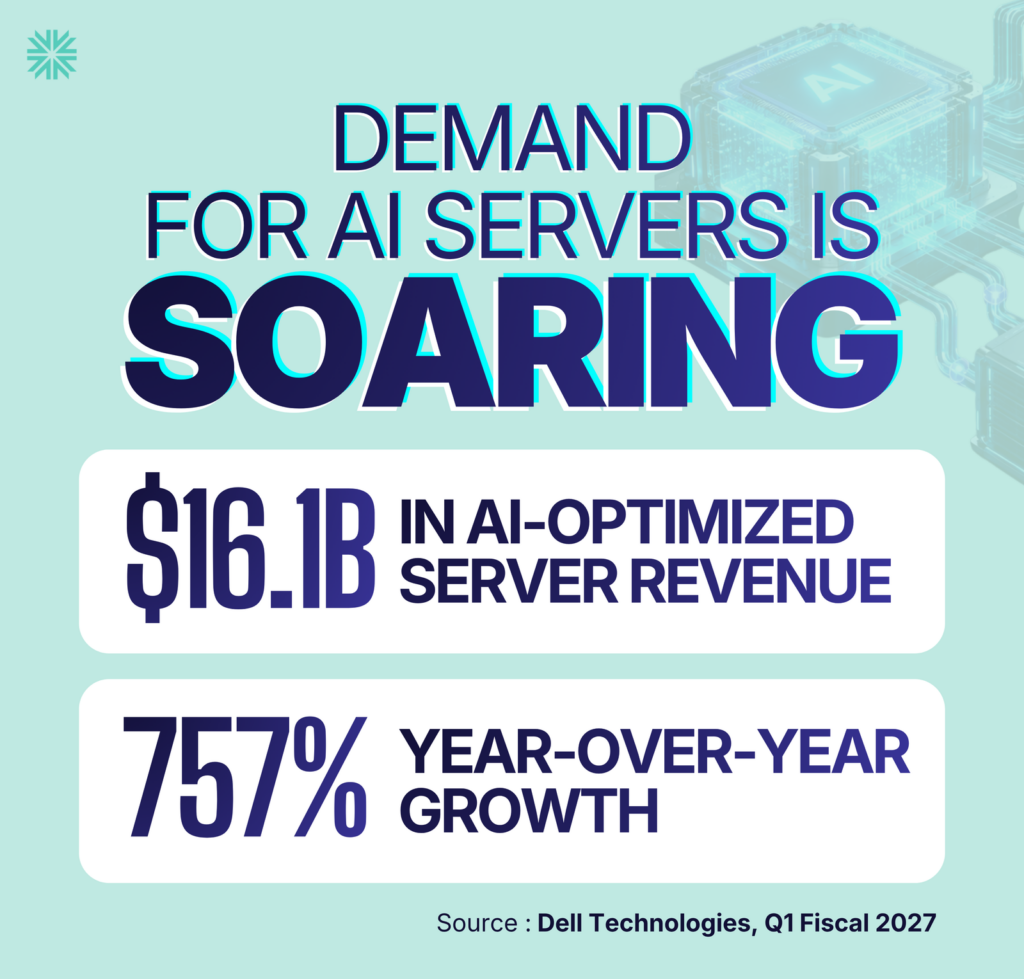
- Dell reported $16.1 billion in AI-optimized server revenue for Q1 fiscal 2027, up 757%. Dell Technologies
- Dell’s traditional server and networking revenue reached $8.5 billion in Q1 fiscal 2027, up 92%. Dell Technologies
- HPE reported $5.5 billion in server revenue for Q2 fiscal 2026, up 32.7% year over year. HPE
- HPE’s Cloud and AI segment produced $7.7 billion in Q2 fiscal 2026 revenue, up 22.9%. HPE
- HPE reported triple-digit year-over-year growth in traditional server orders during Q2 fiscal 2026. HPE
- Lenovo’s Infrastructure Solutions Group reached $8.5 billion in Q1 fiscal 2026-27 revenue, up 98% year over year. Lenovo
- Lenovo’s Infrastructure Solutions Group posted $777 million in operating profit and a 9.1% operating margin for Q1 fiscal 2026-27. Lenovo
Hyperconvergence’s small business server guide covers hardware choices for smaller deployments.
Cloud Server and Workload Statistics
- Enterprise spending on cloud infrastructure services reached $128.6 billion in Q1 2026. Synergy Research Group
- Q1 2026 cloud infrastructure service revenue grew $35 billion, or 35%, from one year earlier. Synergy Research Group
- Trailing 12-month cloud infrastructure service revenue reached $455 billion at the end of Q1 2026. Synergy Research Group
- Amazon held 28% of the worldwide cloud infrastructure services market in Q1 2026. Synergy Research Group
- Microsoft held 21% of the worldwide cloud infrastructure services market in Q1 2026. Synergy Research Group
- Google held 14% of the worldwide cloud infrastructure services market in Q1 2026. Synergy Research Group
- Amazon, Microsoft, and Google held a combined 67% share of the public cloud market in Q1 2026. Synergy Research Group
- Public infrastructure and platform cloud services grew 38% year over year in Q1 2026. Synergy Research Group
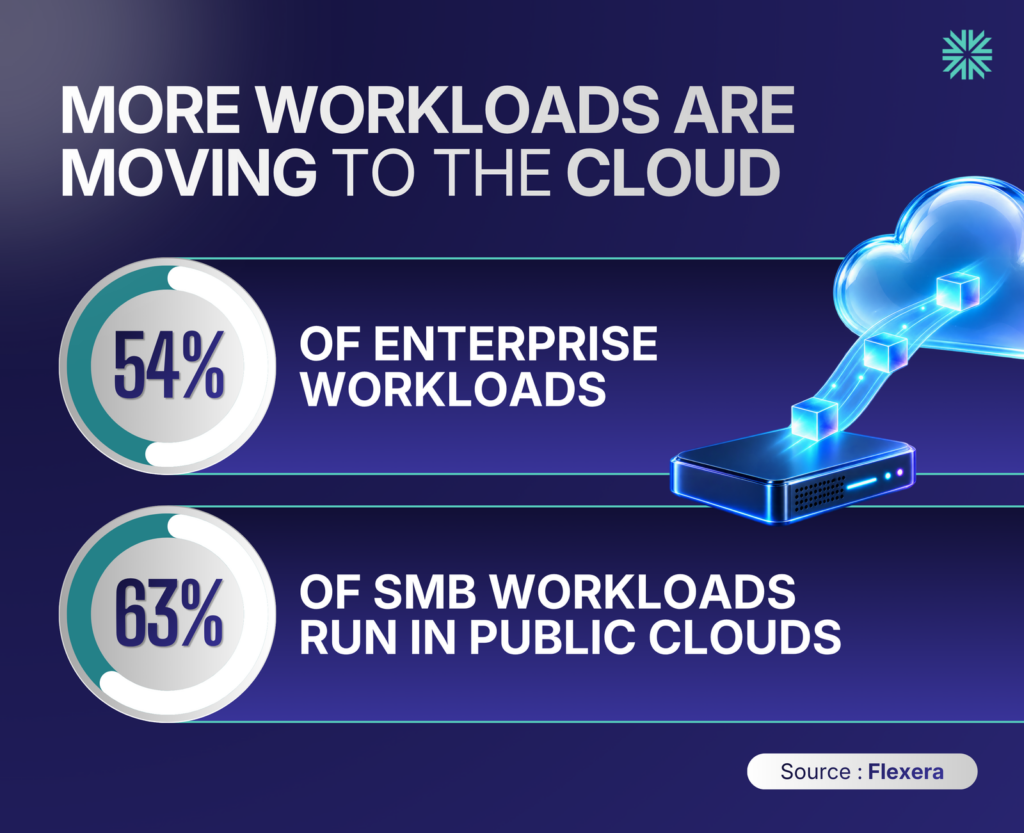
- Enterprises run 54% of their workloads in public clouds, up from 52% one year earlier. Flexera
- Small and midsize businesses run 63% of their workloads in public clouds, up from 55%. Flexera
- Small and midsize businesses place 61% of their data in public clouds. Flexera
- Enterprises place 51% of their data in public clouds. Flexera
- Hybrid environments are in use at 73% of surveyed organizations. Flexera
- Among large enterprises, 76% spend more than $5 million per month on cloud services. Flexera
Hyperconvergence’s top cloud servers guide provides a product-oriented view of this market.
Container, Kubernetes, and Cloud-Native Server Statistics
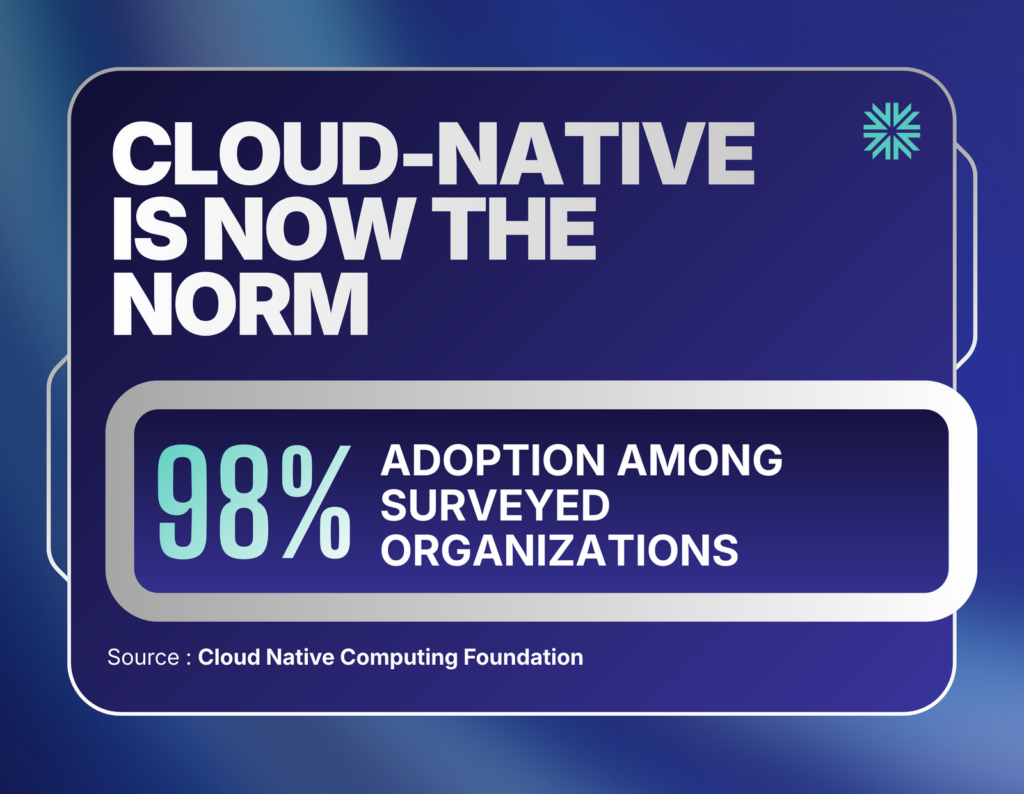
- Cloud-native techniques have reached 98% adoption among surveyed organizations. Cloud Native Computing Foundation
- Among organizations that use containers, 82% run Kubernetes in production, up from 66% in 2023. Cloud Native Computing Foundation
- Fifty-nine percent of organizations say much or nearly all of their application development and deployment is cloud native. Cloud Native Computing Foundation
- Ten percent of organizations remain in the early stages of cloud-native adoption or report no adoption. Cloud Native Computing Foundation
- Among organizations that host generative AI models, 66% use Kubernetes for some or all inference workloads. Cloud Native Computing Foundation
- Seven percent of organizations deploy AI models daily. Cloud Native Computing Foundation
- Forty-seven percent of organizations deploy AI models occasionally. Cloud Native Computing Foundation
- Forty-four percent of organizations do not yet run AI or machine learning workloads on Kubernetes. Cloud Native Computing Foundation
- GitOps is used at 58% of cloud-native innovators, compared with 23% of organizations classed as adopters. Cloud Native Computing Foundation
- Nearly 20% of organizations use continuous profiling in cloud-native environments. Cloud Native Computing Foundation
- Eighty-five percent of organizations say AI is accelerating container adoption. Nutanix
Web Server Software and Operating System Statistics
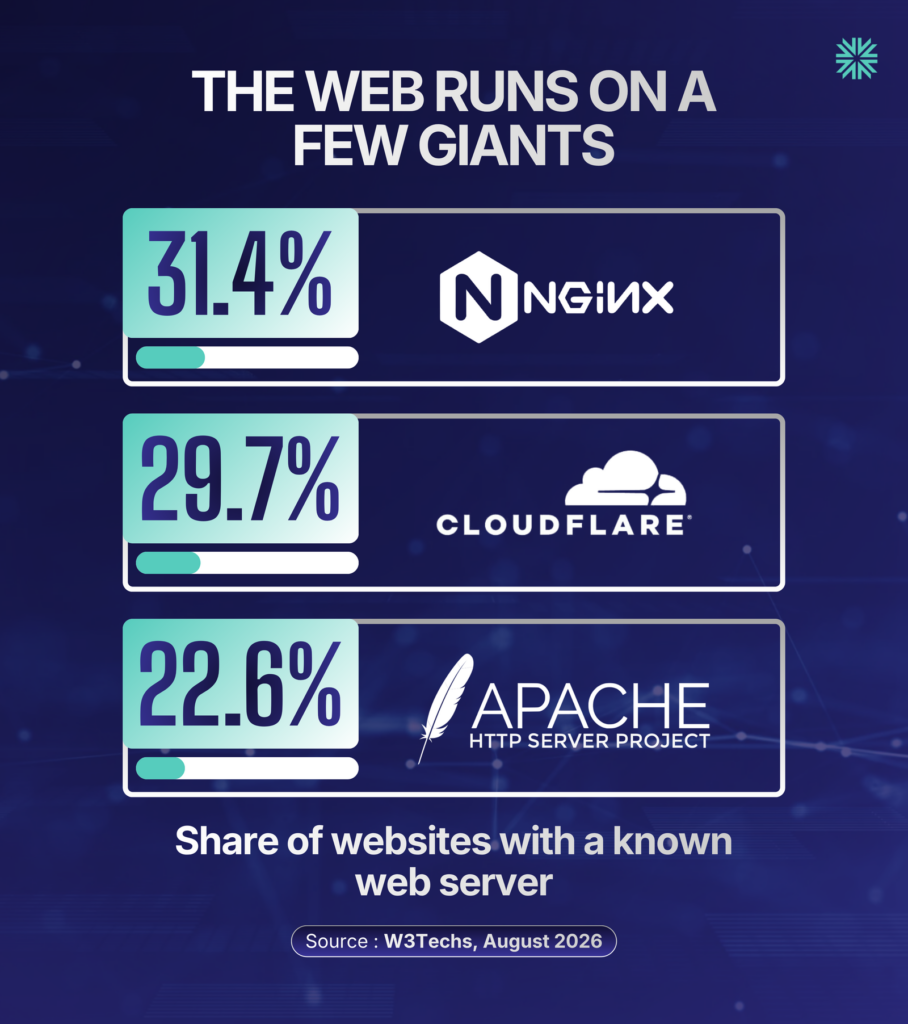
- Nginx is used on 31.4% of websites with a known web server. W3Techs
- Cloudflare Server is used on 29.7% of websites with a known web server. W3Techs
- Apache is used on 22.6% of websites with a known web server. W3Techs
- LiteSpeed is used on 14.8% of websites with a known web server. W3Techs
- Node.js is used on 7.0% of websites with a known web server. W3Techs
- Microsoft IIS is used on 3.1% of websites with a known web server. W3Techs
- Google Servers are used on 1.0% of websites with a known web server. W3Techs
- Cloudflare Server appears on 46.5% of the top 1 million sites, 53.1% of the top 100,000, and 55.6% of the top 1,000. W3Techs
- Apache appears on 9.7% of the top 1,000 websites. W3Techs
- Nginx appears on 27.7% of the top 1 million websites. W3Techs
- Cloudflare Server’s measured web server share rose from 24.1% in August 2025 to 29.7% in August 2026. W3Techs
- Nginx’s measured web server share fell from 33.8% in August 2025 to 31.4% in August 2026. W3Techs
- Unix-based systems run 92.0% of websites with a known operating system. W3Techs
- Windows runs 8.2% of websites with a known operating system. W3Techs
- Linux runs 62.1% of websites with a known operating system. W3Techs
- Netcraft’s July 2026 survey counted 1.495 billion websites. Netcraft
- The same survey counted 305.35 million domains. Netcraft
- Netcraft detected 14.77 million web-facing computers in July 2026. Netcraft
- The July 2026 survey added 5.5 million sites, 1.2 million domains, and 118,277 web-facing computers from June. Netcraft
- OpenResty gained 39.5 million sites in July 2026 and reached an 8.02% site share. Netcraft
Hyperconvergence’s server software explainer covers the programs that manage requests, storage, access, and network services.
Hyperscale, Colocation, and On-Premises Server Statistics
- The global count of operational hyperscale data centers reached 1,360 at the end of Q4 2025. Synergy Research Group
- Hyperscale operators accounted for 48% of global data center capacity at the end of 2025. Synergy Research Group
- Almost 60% of hyperscale capacity operates in facilities owned by hyperscale companies. Synergy Research Group
- Colocation facilities accounted for 20% of global data center capacity at the end of 2025. Synergy Research Group
- On-premises data centers accounted for 32% of global capacity at the end of 2025, down from 56% in 2018. Synergy Research Group
- Hyperscale operators are forecast to control 67% of global data center capacity in 2031. Synergy Research Group
- The on-premises share of global data center capacity is forecast to fall to 19% in 2031. Synergy Research Group
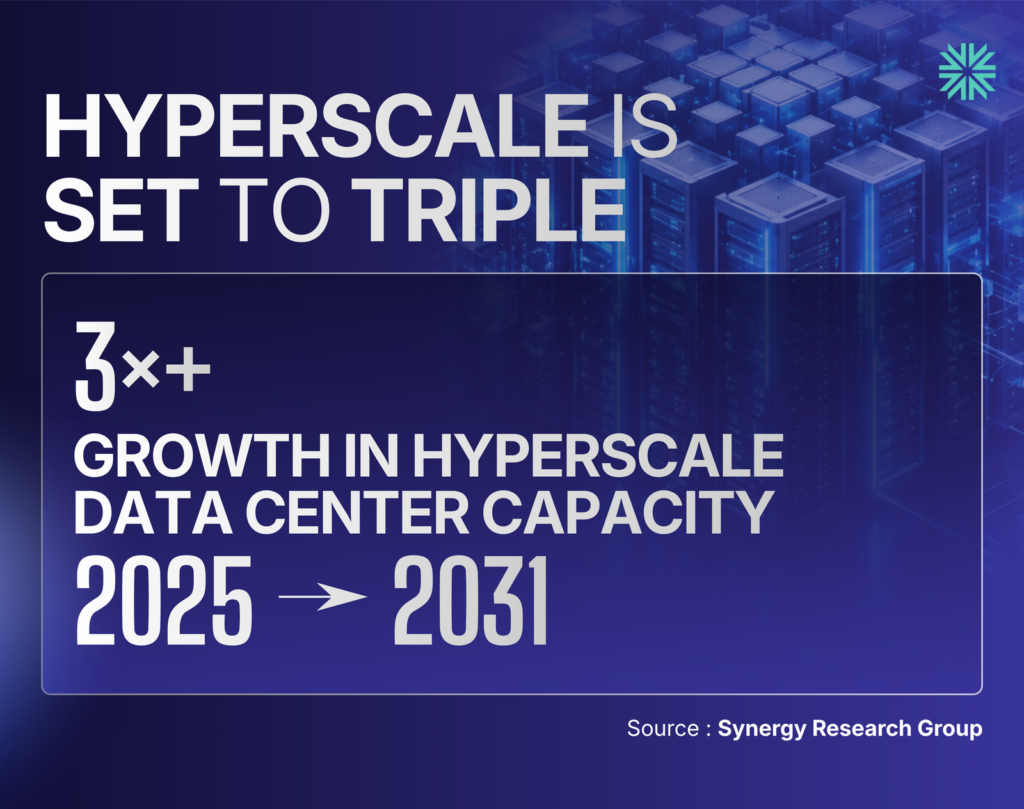
- Hyperscale data center capacity is forecast to more than triple from 2025 to 2031. Synergy Research Group
- Colocation capacity is forecast to grow at a rate close to 10% per year through 2031. Synergy Research Group
Readers planning distributed deployments can use Hyperconvergence’s edge server guide and blade server guide.
Server Storage and Memory Statistics
- Enterprise external OEM storage spending reached $9.9 billion in Q1 2026, up 22.9% year over year. IDC
- The enterprise external OEM storage market reached $35.34 billion in 2025, up 4.3%. IDC
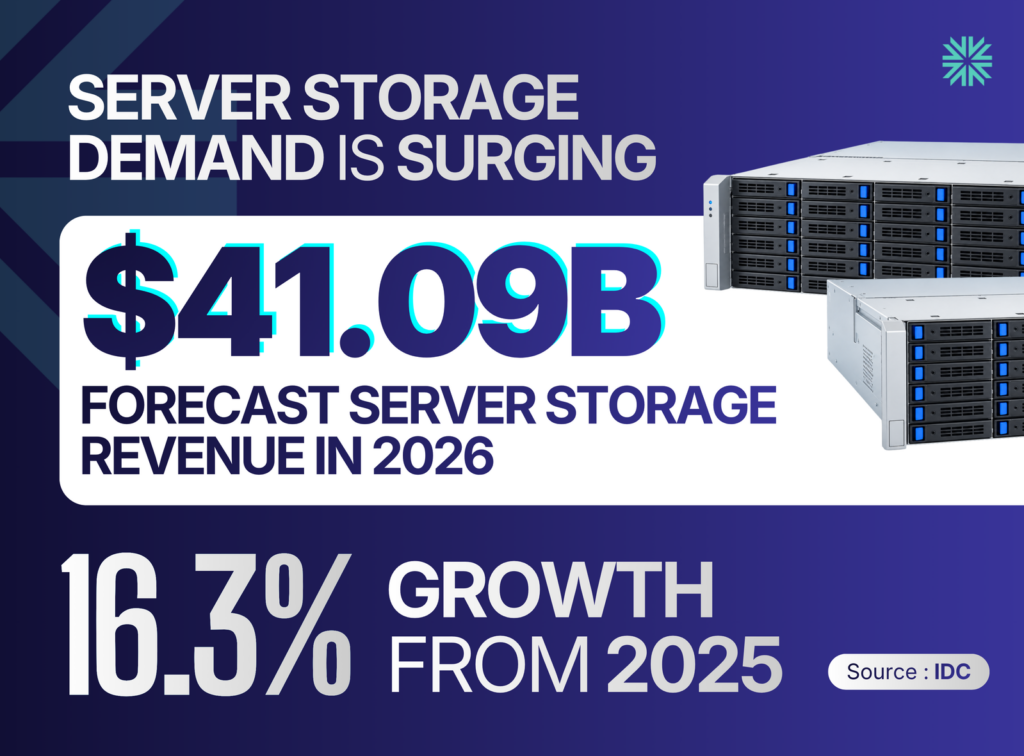
- Enterprise external OEM storage revenue is forecast to reach $41.09 billion in 2026, up 16.3%. IDC
- Enterprise external OEM storage revenue is forecast to reach $43.31 billion in 2027, up 5.4%. IDC
- IDC forecasts a 7.3% compound annual growth rate for enterprise external OEM storage through 2030. IDC
- TrendForce expects the 2026 server DRAM sufficiency ratio to remain between negative 1% and negative 2%. TrendForce
- Global server shipments are forecast to rise 17% in 2026, with faster growth expected in 2027. TrendForce
High-Performance Computing Server Statistics

- The June 2026 TOP500 list contained five verified exascale supercomputers. TOP500
- LineShine ranked first at 2.198 exaflops with 13.79 million cores. TOP500
- El Capitan ranked second at 1.809 exaflops with 11.34 million cores. TOP500
- Frontier ranked third at 1.353 exaflops with 9.07 million cores. TOP500
- Aurora ranked fourth at 1.012 exaflops with 9.26 million cores. TOP500
- JUPITER became Europe’s first exascale system with 1.000 exaflops and 4.80 million cores. TOP500
- Accelerators appeared in 276 TOP500 systems in June 2026, up from 255 six months earlier. TOP500
- The list included 107 systems with NVIDIA Hopper accelerators, 62 with NVIDIA Ampere, and 32 with AMD Instinct. TOP500
- Intel processors powered 53.2% of TOP500 systems, while AMD processors powered 38.4%. TOP500
- Combined TOP500 performance reached 18.73 exaflops, up from 14.99 exaflops six months earlier. TOP500
- The average TOP500 system contained 305,404 cores, up from 270,522 six months earlier. TOP500
- The KAIROS system led the June 2026 Green500 list at 73.28 gigaflops per watt. TOP500
Server Energy, Density, and Cooling Statistics
- Global data center electricity consumption reached about 485 TWh in 2025 and is projected to approach 950 TWh in 2030. International Energy Agency
- Data centers are projected to consume close to 3% of global electricity in 2030. International Energy Agency
- Electricity use from AI-focused data centers is projected to triple between 2025 and 2030. International Energy Agency
- Data center electricity demand rose 17% in 2025, compared with 3% growth in total global electricity demand. International Energy Agency
- Data centers consumed about 415 TWh in 2024, equal to 1.5% of global electricity use. International Energy Agency
- The United States used 45% of data center electricity in 2024, China used 25%, and Europe used 15%. International Energy Agency
- US data centers consumed 4.4% of national electricity in 2023. US Department of Energy
- US data centers could consume 6.7% to 12% of national electricity in 2028. US Department of Energy
- US data center electricity use rose from 58 TWh in 2014 to 176 TWh in 2023 and could reach 325 to 580 TWh in 2028. US Department of Energy
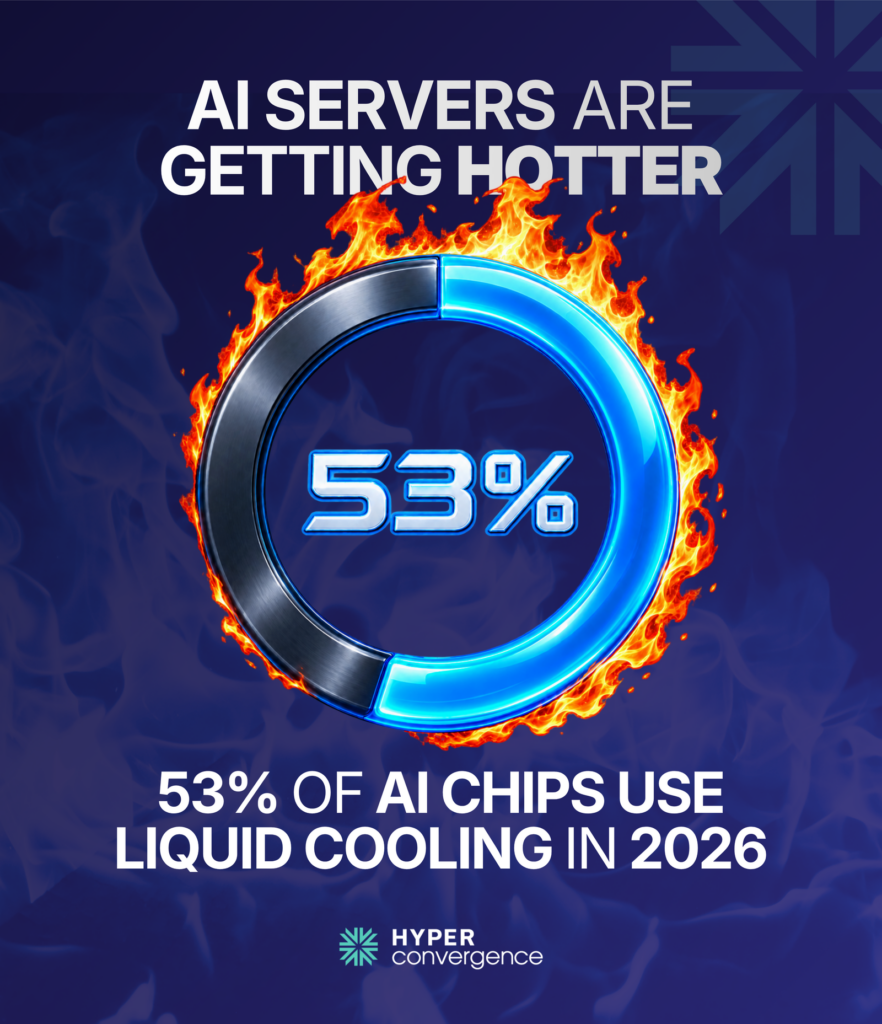
- Liquid cooling penetration among AI chips rose from about 33% in 2025 to 53% in 2026 and is forecast to reach about 60% in 2027. TrendForce
- More than 80% of Google’s AI servers use liquid cooling. TrendForce
- Shipments of NVIDIA GB and VR rack-scale systems are forecast to double in 2026. TrendForce
- AI chip thermal design power has moved above 1 kW, while rack-scale AI systems can consume hundreds of kilowatts. TrendForce
- The global average data center power usage effectiveness ratio is 1.52. Uptime Institute
- Newer and larger data centers often record power usage effectiveness ratios of 1.3 or lower. Uptime Institute
Server Reliability, Outage, and Security Statistics
- Fifty-seven percent of recent major data center outages cost more than $100,000. Uptime Institute
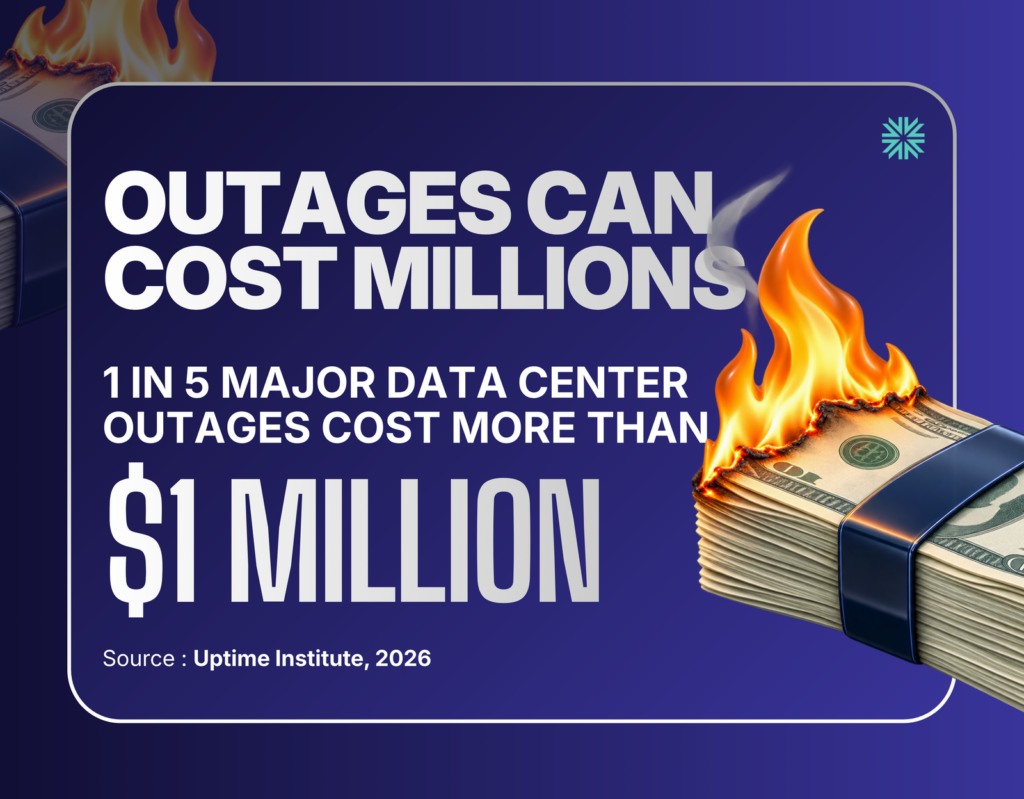
- One in five recent major data center outages cost more than $1 million. Uptime Institute
- About one in 10 organizations reported a serious or severe outage in Uptime Institute’s 2026 analysis. Uptime Institute
- Software vulnerability exploitation served as the initial access route in 31% of breaches studied in the 2026 Data Breach Investigations Report. Verizon
- Credential abuse served as the initial access route in 13% of breaches. Verizon
- Ransomware appeared in 48% of breaches studied in the 2026 report. Verizon
- Third-party involvement rose 60% and appeared in 48% of breaches. Verizon
- Organizations fully remediated 26% of critical CISA Known Exploited Vulnerabilities in 2025, down from 38% one year earlier. Verizon
- Median time to fully resolve critical vulnerabilities rose from 32 days to 43 days. Verizon
- The median organization faced 50% more critical vulnerabilities than one year earlier. Verizon
- Only 23% of third-party organizations fully remediated missing or improperly secured cloud exposure. Verizon
- The global average cost of a data breach reached $4.99 million in 2026, up 12%. IBM
- AI-driven attacks increased 56% in IBM’s 2026 breach study. IBM
- Breaches involving AI model inversion cost an average of $6 million. IBM
- Extensive use of AI and security automation reduced average breach costs by $1.93 million. IBM
Hyperconvergence’s cloud security statistics article provides more data on cloud threats, controls, and business risk.
What the Server Data Means for IT Planning
Server spending is rising much faster than unit shipments. AI systems, accelerators, high-capacity memory, fast networking, and liquid cooling account for a growing share of infrastructure budgets.
Cloud infrastructure remains concentrated among three providers, while enterprises continue to keep a material share of workloads and data outside public clouds. Hybrid architecture remains a practical default for many large organizations.
Capacity planning now needs power, cooling, memory supply, and physical site availability in the same model as compute demand. The projected rise in electricity use makes energy access a core server procurement constraint.
Reliability and security remain direct financial concerns. Outage costs, slow vulnerability remediation, third-party exposure, and higher breach costs make lifecycle management as important as initial hardware selection.
Editorial Note
Market forecasts reflect each research firm’s definitions, currency treatment, reporting periods, and survey methods. Vendor fiscal quarters do not follow one shared calendar. Web technology shares can vary because measurement services use different detection methods and site populations. Readers should review the named source before placing a figure in a financial model, board report, or procurement document.
Server Statistics FAQs
1. What Is a Server?
A server is a physical or virtual system that provides computing resources, data, applications, or network services to other devices. Common server roles include web hosting, file storage, databases, email, authentication, virtualization, and AI processing.
2. How Large Is the Global Server Market?
IDC forecasts worldwide server revenue of about $647 billion in 2026 and $930.6 billion in 2027. AI systems and non-x86 platforms account for much of the recent revenue growth.
3. Why Is Server Spending Growing Faster Than Unit Shipments?
Server spending is rising faster because AI accelerators, high-capacity memory, advanced networking, storage, and cooling increase the cost of each system. Q1 2026 spending grew 30.7%, while unit shipments increased 3.3%.
4. What Is the Difference Between x86 and Non-x86 Servers?
X86 servers use processor architectures commonly supplied by Intel and AMD. Non-x86 systems include Arm-based and other specialized platforms that are gaining revenue share in accelerated computing and AI deployments.
5. What Is an AI Server?
An AI server combines processors, GPUs or other accelerators, high-bandwidth memory, fast networking, and specialized software for model training or inference. These systems require more power and cooling than many general-purpose servers.
6. How Much Is Being Spent on AI Infrastructure?
IDC forecasts $497 billion in worldwide AI infrastructure spending during 2026. Servers represented 97.6% of AI infrastructure spending in Q1 2026.
7. How Do Cloud Servers Differ From Physical Servers?
Cloud servers provide virtualized capacity through a service provider, while physical servers give one organization direct control over dedicated hardware. The cloud server vs. physical server guide explains the operational and cost differences.
8. What Server Type Suits a Small Business?
The suitable type depends on workload size, storage needs, remote access, backup requirements, budget, and available IT support. Small organizations commonly compare tower servers, rack servers, network-attached storage, and cloud servers.
9. What Is a Blade Server?
A blade server is a compact modular server installed in a shared chassis that supplies power, cooling, networking, and management. Blade systems support dense deployments but require compatible chassis infrastructure.
10. What Is an Edge Server?
An edge server processes data close to users, devices, or operational sites. Shorter data paths can reduce latency, bandwidth use, and dependence on a distant cloud region.
11. What Is a Dedicated Server?
A dedicated server assigns an entire physical machine to one customer or organization. It provides predictable resources and greater configuration control than shared hosting or many multitenant services.
12. Which Web Server Software Has the Largest Share?
W3Techs measured Nginx on 31.4% of websites with a known web server in August 2026. Cloudflare Server followed at 29.7%, while Apache held 22.6%.
13. Which Operating System Runs Most Web Servers?
Unix-based systems run 92% of websites with a known operating system. Linux alone accounts for 62.1% of sites where the operating system can be detected.
14. What Is a Hyperscale Data Center?
A hyperscale data center is a very large facility designed for rapid expansion, automation, and high-volume computing. The worldwide operational count reached 1,360 at the end of 2025.
15. What Does Server PUE Measure?
Power usage effectiveness compares a data center’s total energy use with the energy delivered to computing equipment. A ratio closer to 1.0 indicates less facility overhead for cooling, power conversion, and related systems.
16. Why Are AI Servers Moving to Liquid Cooling?
Liquid cooling carries heat away from high-power processors more efficiently than many air-cooling systems. Its penetration among AI chips reached 53% in 2026 and is forecast to approach 60% in 2027.
17. How Expensive Are Major Server Outages?
Uptime Institute found that 57% of recent major data center outages cost more than $100,000. One in five exceeded $1 million.
18. What Are the Main Server Security Risks?
Major risks include unpatched software, stolen credentials, exposed management interfaces, weak configurations, ransomware, third-party access, and inadequate monitoring. Vulnerability exploitation initiated 31% of breaches studied in Verizon’s 2026 report.
19. Which Server Statistics Matter Most for Procurement?
Procurement teams should track market prices, processor architecture, workload growth, memory supply, storage demand, energy use, rack density, cooling needs, support terms, and outage costs. These figures affect total ownership cost and capacity plans.
20. How Often Should Server Statistics Be Updated?
Market share, vendor revenue, shipment, pricing, and infrastructure figures should be reviewed at least quarterly. Long-term forecasts, energy projections, and annual survey results should be checked when their publishers issue new editions.
[…] This shift is also reflected in broader server and cloud infrastructure trends. See our latest server statistics for data on cloud infrastructure spending, workload adoption, server shipments, and market […]