100+ Cloud Server Statistics for 2026
Cloud infrastructure service revenue reached $143.4 billion in Q2 2026, a 43% increase from the same quarter in 2025. Generative AI, accelerated computing, and rising enterprise demand pushed the market to its fastest growth rate in eight years.
Cloud servers supply virtual machines, containers, databases, storage, AI compute, and application platforms through shared or dedicated infrastructure. Organizations now use them across public, private, hybrid, multicloud, sovereign, and edge environments.
This article presents 150 cloud server statistics covering market growth, provider share, spending, workloads, FinOps, AI, Kubernetes, infrastructure, and security. Every numbered statistic names its source.
Cloud Server Statistics at a Glance
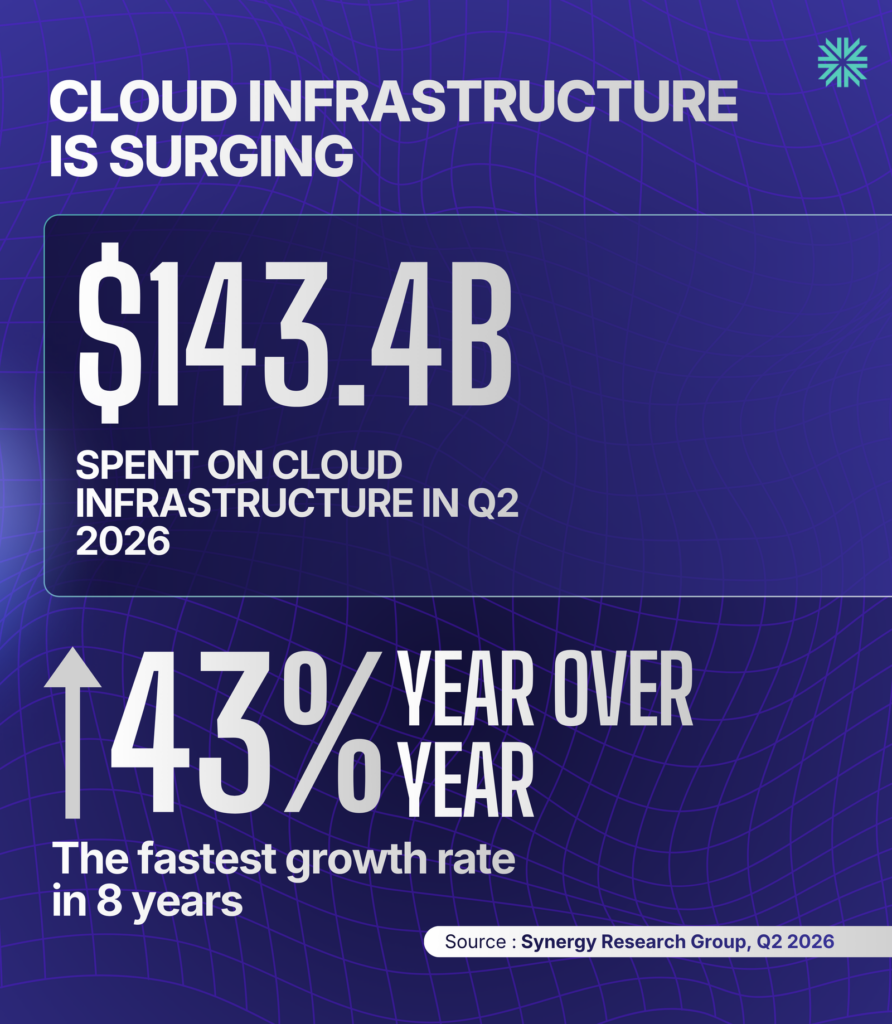
- Quarterly cloud infrastructure service revenue reached $143.4 billion in Q2 2026.
- AWS, Microsoft, and Google held 67% of the public cloud market.
- Hybrid cloud environments were in use at 73% of surveyed organizations.
- Estimated wasted IaaS and PaaS spending reached 29%.
- Worldwide IaaS spending is forecast to reach $287.3 billion in 2026.
Cloud Server Market Size and Growth Statistics
- Quarterly cloud infrastructure service revenue reached $143.4 billion in Q2 2026. Synergy Research Group
- Cloud infrastructure service revenue increased by more than $43 billion from Q2 2025 to Q2 2026. Synergy Research Group
- The cloud infrastructure service market grew 43% year over year in Q2 2026. Synergy Research Group
- The annual cloud infrastructure growth rate increased for 11 consecutive quarters through Q2 2026. Synergy Research Group
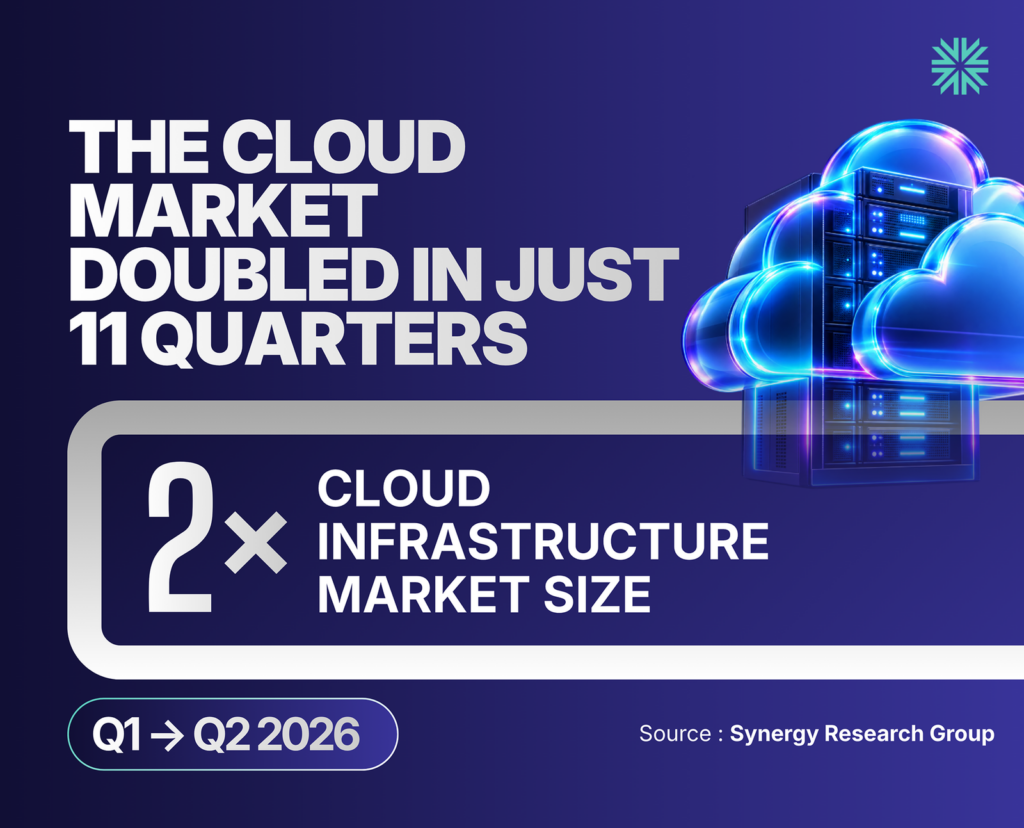
- The quarterly cloud infrastructure market doubled during the 11 quarters ending in Q2 2026. Synergy Research Group
- Trailing 12-month cloud infrastructure service revenue reached $500 billion in Q2 2026. Synergy Research Group
- Public IaaS and PaaS revenue grew 47% year over year in Q2 2026. Synergy Research Group
- Generative AI-specific cloud services grew 165% year over year in Q2 2026. Synergy Research Group
- The three largest providers controlled 67% of the public cloud market in Q2 2026. Synergy Research Group
- Worldwide IaaS spending reached $222.17 billion in 2025, up 25.3%. Gartner
- Worldwide IaaS spending is forecast to reach $287.35 billion in 2026. Gartner
- The worldwide IaaS market is forecast to grow 29.3% in 2026. Gartner
- Worldwide IaaS spending is forecast to reach $359.90 billion in 2027. Gartner
- The worldwide IaaS market is forecast to grow 25.2% in 2027. Gartner
- Sovereign cloud IaaS spending is forecast to reach $80.43 billion in 2026, up 35.6%. Gartner
Hyperconvergence’s cloud server vs. physical server guide explains the cost, control, scalability, and maintenance differences between these deployment models.
Cloud Provider Market Share and Revenue Statistics
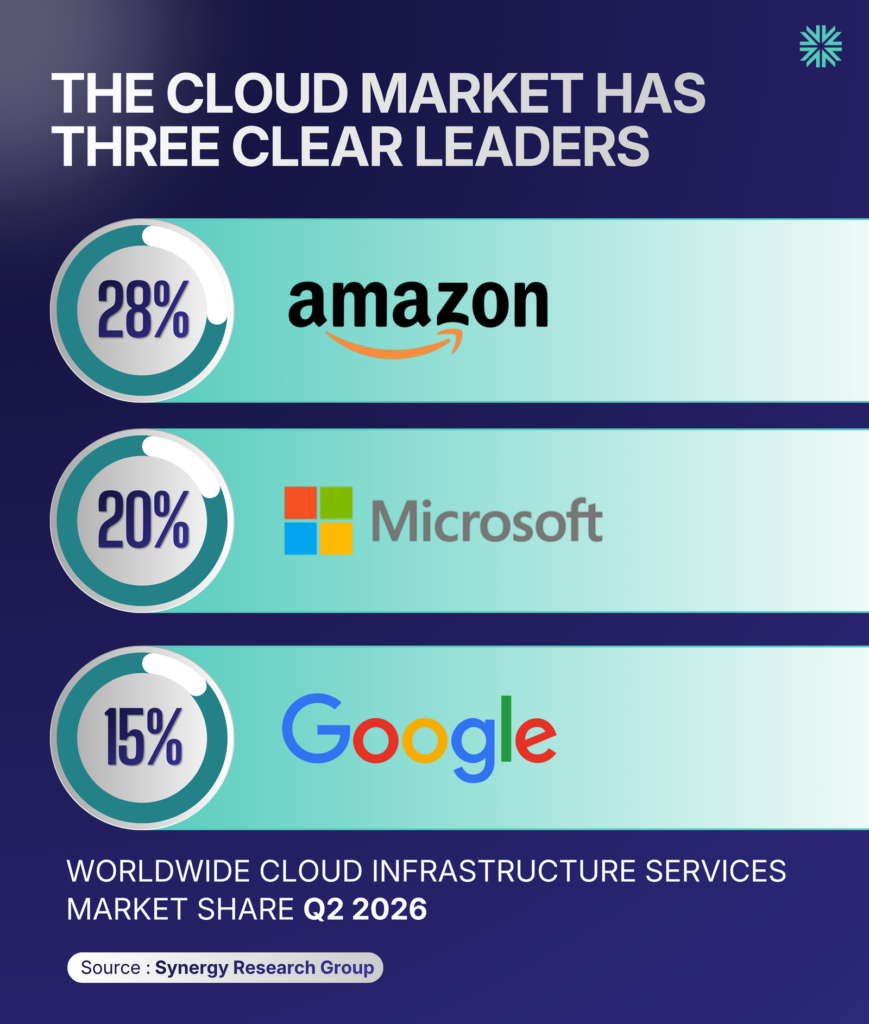
- Amazon held 28% of the worldwide cloud infrastructure services market in Q2 2026. Synergy Research Group
- Microsoft held 20% of the worldwide cloud infrastructure services market in Q2 2026. Synergy Research Group
- Google held 15% of the worldwide cloud infrastructure services market in Q2 2026. Synergy Research Group
- Nine neocloud companies ranked among the 40 largest cloud providers based on Q2 2026 revenue. Synergy Research Group
- AWS ran some or significant workloads for 83% of Flexera’s 2026 cloud survey respondents. Flexera
- Microsoft Azure ran some or significant workloads for 79% of respondents. Flexera
- AWS was in use, in testing, or planned at 88% of surveyed organizations. Flexera
- Microsoft Azure was in use, in testing, or planned at 88% of surveyed organizations. Flexera
- AWS ran active workloads for 84% of surveyed enterprises. Flexera
- Microsoft Azure ran active workloads for 82% of surveyed enterprises. Flexera
- Azure reached 94% enterprise adoption when experimentation and future plans were included. Flexera
- AWS reached 92% enterprise adoption when experimentation and future plans were included. Flexera
- AWS ran some or significant workloads for 77% of surveyed small and midsize businesses. Flexera
- Microsoft Azure ran some or significant workloads for 63% of surveyed small and midsize businesses. Flexera
- AWS generated $42.2 billion in Q2 2026 revenue, up 37% year over year. Amazon
- AWS reached an annualized revenue run rate of $169 billion in Q2 2026. Amazon
- AWS operating income reached $16.6 billion in Q2 2026, compared with $10.2 billion in Q2 2025. Amazon
- AWS’s AI business passed a $25 billion annual revenue run rate in Q2 2026. Amazon
- Microsoft Cloud revenue reached $59.3 billion in Q4 fiscal 2026, up 27%. Microsoft
- Microsoft Cloud generated $214.4 billion in fiscal 2026 revenue, up 27%. Microsoft
- Azure and other cloud services revenue grew 43% in Q4 fiscal 2026. Microsoft
- Azure revenue passed $100 billion for the first time during fiscal 2026. Microsoft
- Google Cloud generated $17.7 billion in Q4 2025 revenue, up 48% year over year. Alphabet
- Oracle Cloud Infrastructure generated $5.8 billion in Q4 fiscal 2026 revenue, up 93%. Oracle
- Oracle Cloud Infrastructure generated $18.1 billion in fiscal 2026 revenue, up 77%. Oracle
Hyperconvergence’s top cloud servers article provides a product-focused view of major cloud platforms and their common use cases.
Hybrid, Multicloud, and Workload Statistics
- Hybrid cloud environments were in use at 73% of surveyed organizations in 2026. Flexera
- Hybrid cloud adoption increased 3 percentage points from 2025 to 2026. Flexera
- Multicloud adoption increased 2 percentage points from 2025 to 2026. Flexera
- Fourteen percent of organizations operated only in a multicloud environment without a private cloud. Flexera
- Hybrid cloud was in use at 69% of organizations with 5,000 or fewer employees. Flexera
- Hybrid cloud was in use at 78% of organizations with more than 5,000 employees. Flexera
- Hybrid cloud was in use at 68% of organizations spending up to $500,000 per month on cloud services. Flexera
- Hybrid cloud was in use at 79% of organizations spending more than $500,000 per month on cloud services. Flexera
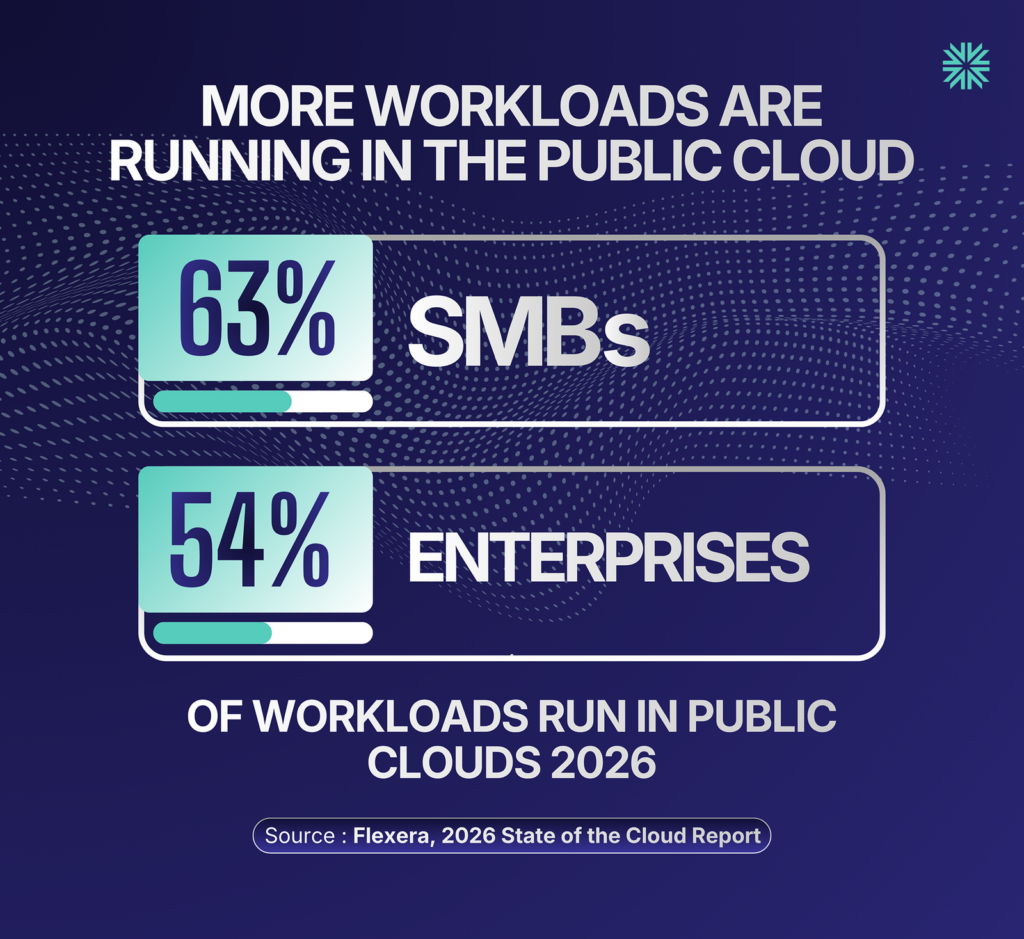
- Enterprises ran 54% of their workloads in public clouds in 2026. Flexera
- Enterprises ran 52% of their workloads in public clouds one year earlier. Flexera
- Small and midsize businesses ran 63% of their workloads in public clouds in 2026. Flexera
- Small and midsize businesses ran 55% of their workloads in public clouds one year earlier. Flexera
- Small and midsize businesses stored 61% of their data in public clouds. Flexera
- Enterprises stored 51% of their data in public clouds. Flexera
- The share of cloud workloads repatriated to private or on-premises systems increased 2 percentage points year over year. Flexera
- The share of cloud data repatriated to private or on-premises systems increased 2 percentage points year over year. Flexera
- Data sovereignty was a high priority for 80% of organizations surveyed in the 2026 Enterprise Cloud Index. Nutanix
Cloud Server Spending and FinOps Statistics
- Sixteen percent of organizations spent between $200,001 and $500,000 per month on public cloud services. Flexera
- Sixty-nine percent of small and midsize businesses spent less than $50,000 per month on public cloud services. Flexera
- Seventy-six percent of large enterprises spent more than $5 million per month on public cloud services. Flexera
- Twenty-seven percent of organizations expected their public cloud spending to increase. Flexera
- Seventeen percent of organizations exceeded their public cloud budgets during the previous year. Flexera
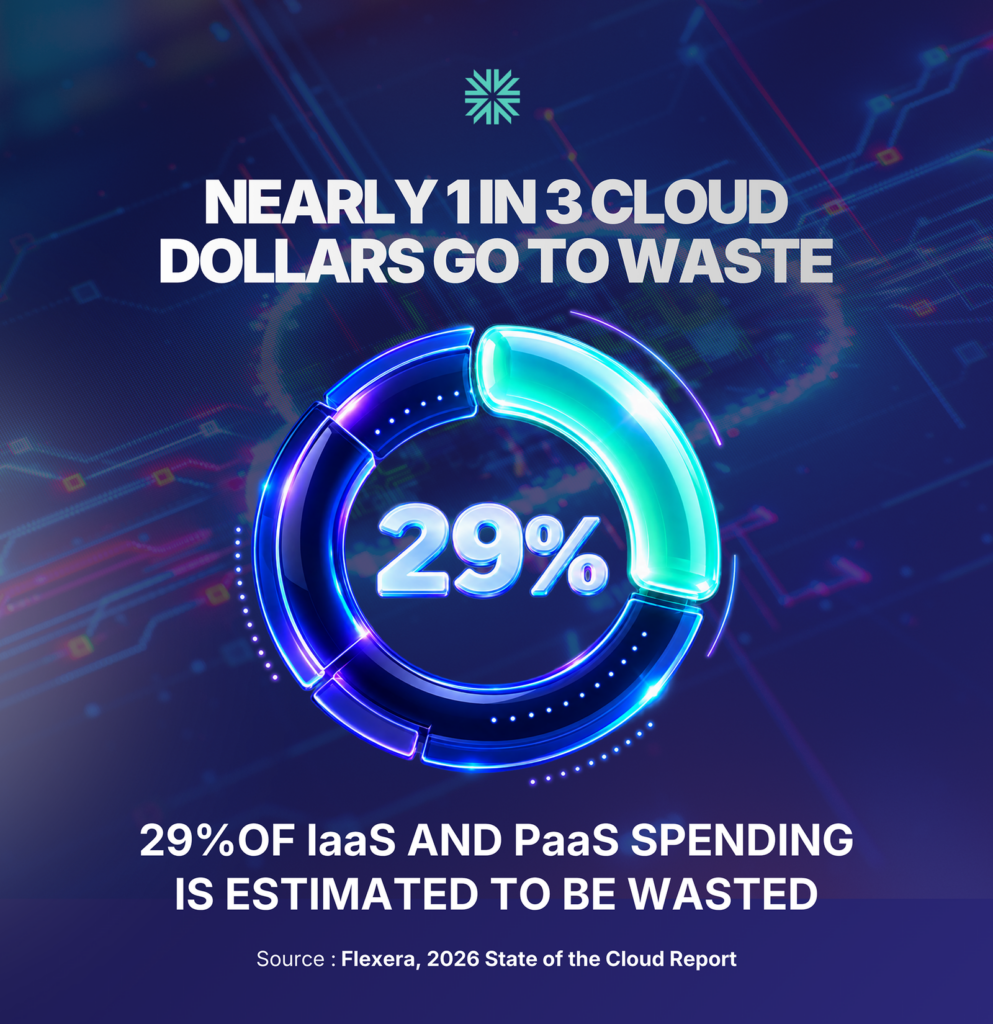
- Organizations estimated that 29% of their IaaS and PaaS spending was wasted. Flexera
- Estimated wasted public cloud software spending increased 1 percentage point year over year. Flexera
- Managing cloud costs was a challenge for 85% of surveyed organizations. Flexera
- Cloud security was a challenge for 82% of surveyed organizations. Flexera
- Managing software licenses was a cloud challenge for 78% of surveyed organizations. Flexera
- Optimizing existing cloud use was a top initiative for 68% of organizations. Flexera
- Migrating more workloads to the cloud was a top initiative for 49% of organizations. Flexera
- Better financial reporting on cloud costs was a top initiative for 42% of organizations. Flexera
- Business-unit value was used as a cloud progress metric at 64% of organizations. Flexera
- Use of business-unit value as a cloud metric increased 12 percentage points in one year. Flexera
- Geographic reach was used as a cloud progress metric at 40% of organizations. Flexera
- Use of geographic reach as a cloud metric rose from 29% to 40%. Flexera
- A cloud center of excellence or similar team operated at 71% of organizations. Flexera
- Cloud center of excellence adoption rose from 69% to 71% in one year. Flexera
- A cloud center of excellence operated at 76% of surveyed enterprises. Flexera
- A cloud center of excellence operated at 49% of surveyed small and midsize businesses. Flexera
- A FinOps team operated at 63% of organizations in 2026. Flexera
- A FinOps team operated at 59% of organizations in 2025. Flexera
- A FinOps team operated at 51% of organizations in 2024. Flexera
- A cloud team or cloud center of excellence held primary cloud cost responsibility at 56% of organizations. Flexera
- FinOps teams held cloud cost responsibility at 45% of organizations, up from 38%. Flexera
- Business units held cloud cost responsibility at 25% of organizations, up from 20%. Flexera
- Software asset management teams held cloud cost responsibility at 15% of organizations, up from 6%. Flexera
- Google Committed Use Discounts were used at 48% of organizations, up 4 percentage points. Flexera
- AWS Reserved Instances were used at 45% of organizations, up 3 percentage points. Flexera
- Unit economics metrics were tracked at 49% of organizations, up from 40%. Flexera
Cloud Services and AI Workload Statistics
- Public cloud data warehouse services were in use at 71% of organizations. Flexera
- Relational database as a service products were in use at 64% of organizations. Flexera
- Generative AI public cloud services were in active use at 58% of organizations. Flexera
- Generative AI public cloud service use stood at 50% one year earlier. Flexera
- Public cloud container services were in use at 56% of organizations. Flexera
- Non-generative AI and machine learning cloud services were in use at 52% of organizations. Flexera
- Non-generative AI and machine learning cloud service use stood at 49% one year earlier. Flexera
- Public cloud search services were in use at 49% of organizations. Flexera
- Public cloud search service use stood at 55% one year earlier. Flexera
- Extensive use of generative AI public cloud services reached 45% in 2026. Flexera
- Extensive use of generative AI public cloud services stood at 36% in 2025. Flexera
- Thirty-six percent of organizations used generative AI cloud services sparingly. Flexera
- Eighteen percent of organizations were experimenting with generative AI cloud services. Flexera
- Extensive or limited generative AI cloud service use reached a combined 81%. Flexera
- A dedicated AI governance team or leader was present at 47% of large enterprises. Flexera
- Security and compliance risks were the leading cloud AI scaling challenge for 53% of organizations. Flexera
- Data quality for model training was a cloud AI scaling challenge for 40% of organizations. Flexera
- AI skills gaps were a cloud AI scaling challenge for 30% of organizations. Flexera
- Unpredictable costs were a cloud AI scaling challenge for 30% of organizations. Flexera
- A lack of AI-specific FinOps skills or frameworks was a challenge for 12% of organizations. Flexera
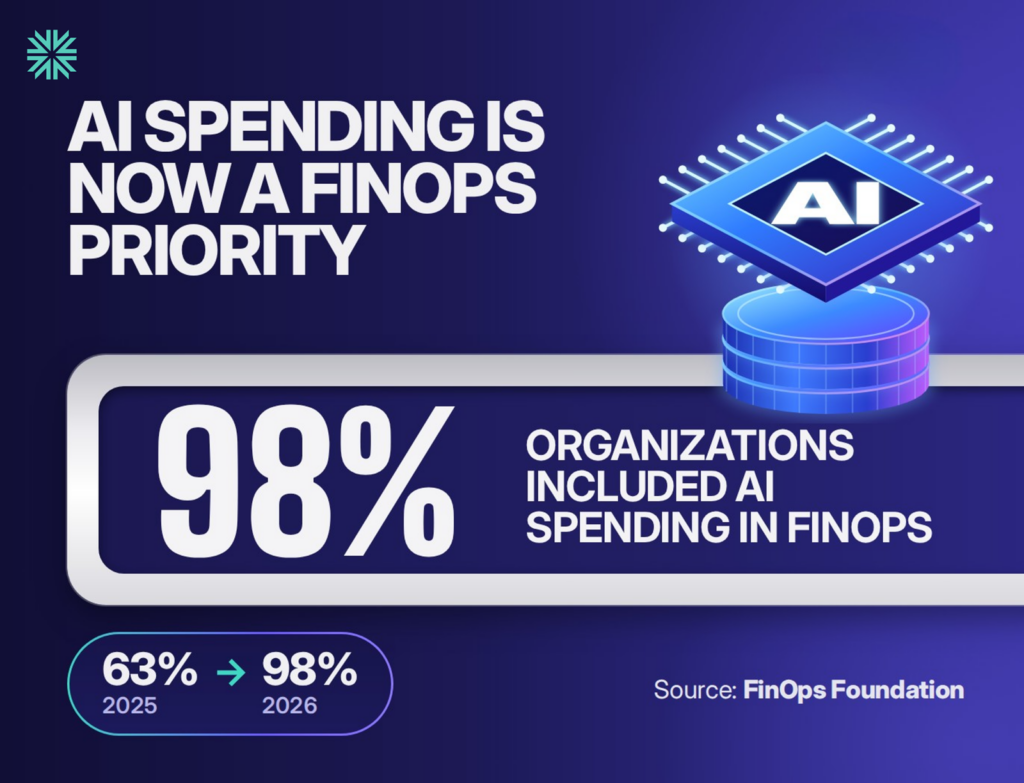
- AI spending was within FinOps scope at 98% of organizations in 2026, up from 63% in 2025. FinOps Foundation
- AI-optimized IaaS spending is forecast to reach $42.28 billion in 2026, up 96.4%. Gartner
- Inference-focused AI IaaS spending is forecast to reach $23.3 billion in 2026, compared with $19.0 billion for training. Gartner
- Inference is forecast to represent 55% of AI-optimized IaaS spending in 2026 and 59% in 2027. Gartner
Cloud-Native and Kubernetes Statistics
- Cloud-native techniques were adopted at 98% of surveyed organizations. Cloud Native Computing Foundation
- Kubernetes ran in production at 82% of organizations that used containers. Cloud Native Computing Foundation
- Production Kubernetes use stood at 66% among container users in 2023. Cloud Native Computing Foundation
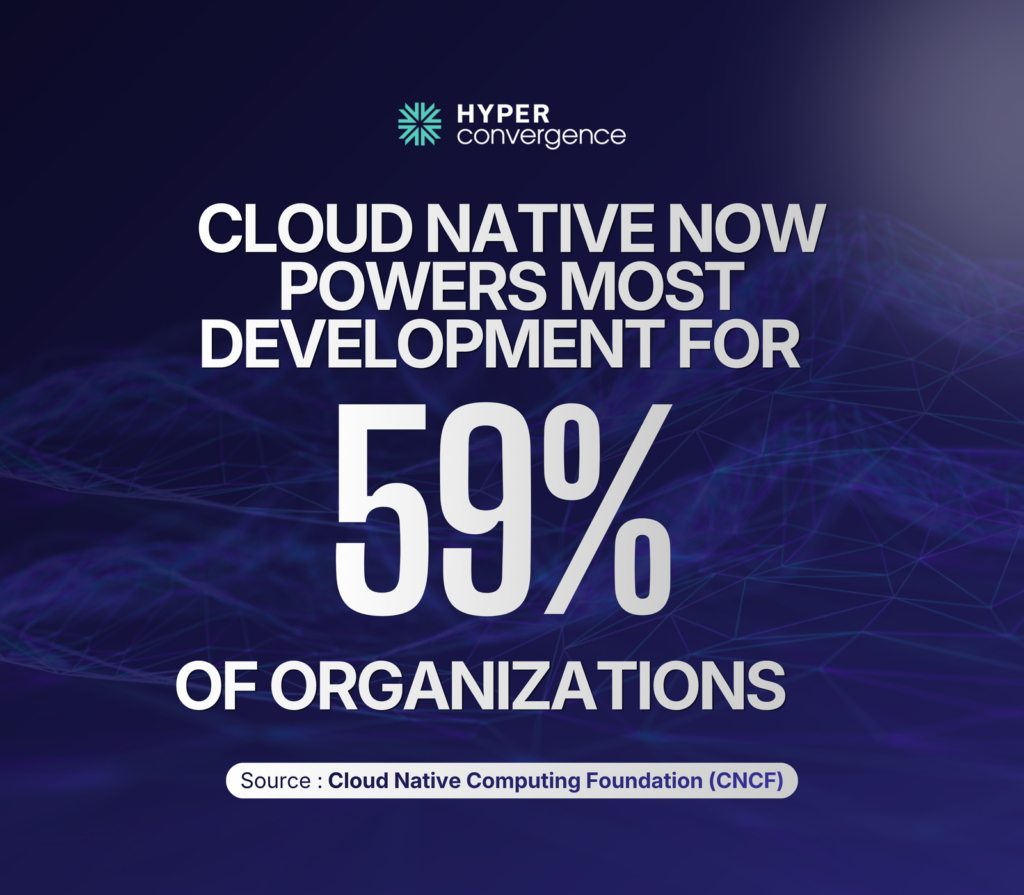
- Fifty-nine percent of organizations described much or nearly all of their development and deployment as cloud native. Cloud Native Computing Foundation
- Ten percent of organizations remained in the early stages of cloud-native use or reported no adoption. Cloud Native Computing Foundation
- Kubernetes managed some or all inference workloads at 66% of organizations hosting generative AI models. Cloud Native Computing Foundation
- Seven percent of organizations deployed AI models daily. Cloud Native Computing Foundation
- Forty-seven percent of organizations deployed AI models occasionally. Cloud Native Computing Foundation
- Forty-four percent of organizations did not run AI or machine learning workloads on Kubernetes. Cloud Native Computing Foundation
- GitOps was used extensively at 58% of cloud-native innovators. Cloud Native Computing Foundation
- GitOps was used extensively at 23% of organizations classed as cloud-native adopters. Cloud Native Computing Foundation
- Nearly 20% of organizations used profiling within their observability systems. Cloud Native Computing Foundation
- Cultural change within development teams was a cloud-native challenge for 47% of organizations. Cloud Native Computing Foundation
- A lack of training was a cloud-native challenge for 36% of organizations. Cloud Native Computing Foundation
Cloud Region and Data Center Statistics
- AWS operated 39 geographic cloud regions in August 2026. Amazon Web Services
- AWS operated 124 Availability Zones in August 2026. Amazon Web Services
- AWS had announced plans for seven more Availability Zones and two more regions. Amazon Web Services
- AWS operated more than 750 CloudFront points of presence and 15 regional edge caches. Amazon Web Services
- The AWS global network contained nearly 20 million kilometers of fiber. Amazon Web Services
- Google Cloud operated 43 regions as of June 30, 2026. Google Cloud
- Google Cloud operated 130 zones as of June 30, 2026. Google Cloud
- Google Cloud operated more than 200 network edge locations. Google Cloud
- Google’s global network contained 10 million kilometers of terrestrial and subsea fiber. Google Cloud
- Microsoft Azure operated more than 80 regions in August 2026. Microsoft Azure
- Microsoft Azure operated more than 500 data centers in August 2026. Microsoft Azure
- Azure services were commercially available in 140 countries and regions. Microsoft Azure
- The worldwide count of operational hyperscale data centers reached 1,360 at the end of Q4 2025. Synergy Research Group
- Hyperscale operators controlled 48% of worldwide data center capacity at the end of 2025. Synergy Research Group
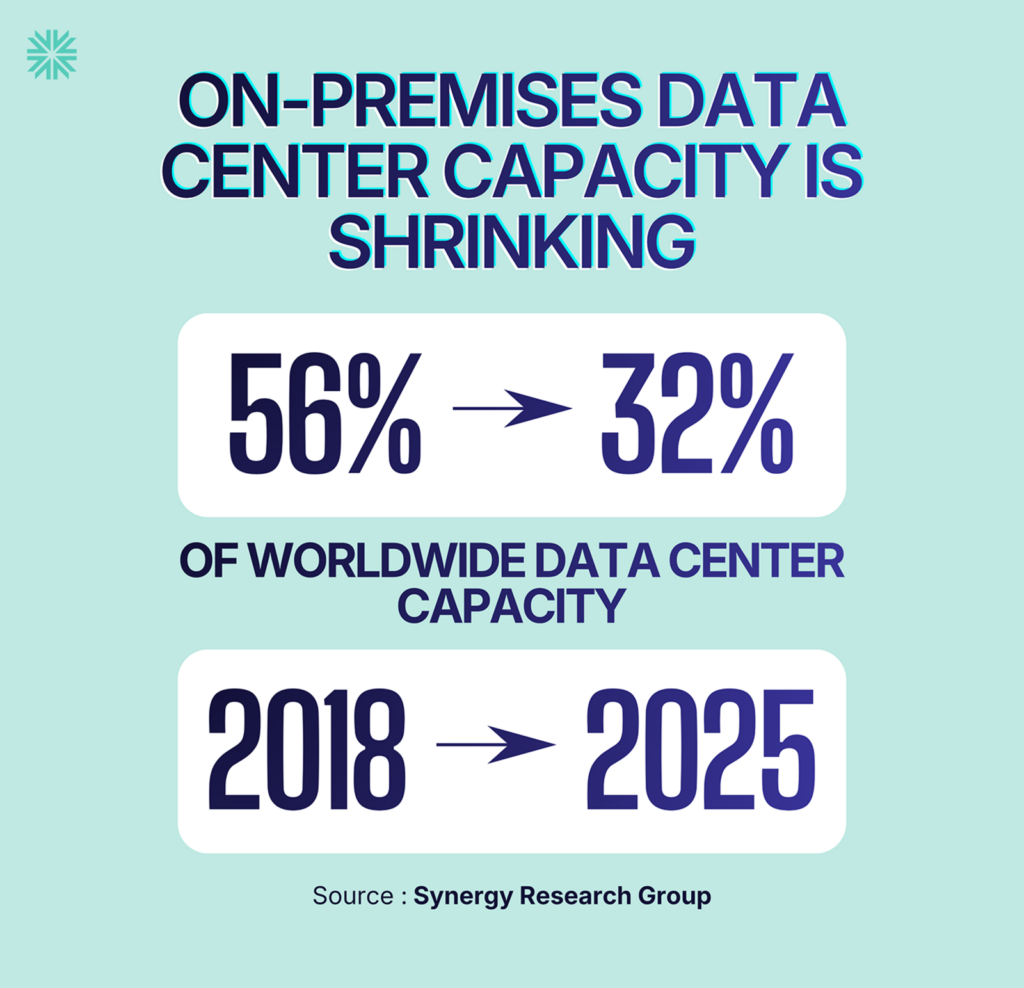
- On-premises facilities held 32% of worldwide data center capacity at the end of 2025, down from 56% in 2018. Synergy Research Group
Hyperconvergence’s edge server guide covers compute placement closer to users, devices, and data sources.
Cloud Server Security Statistics
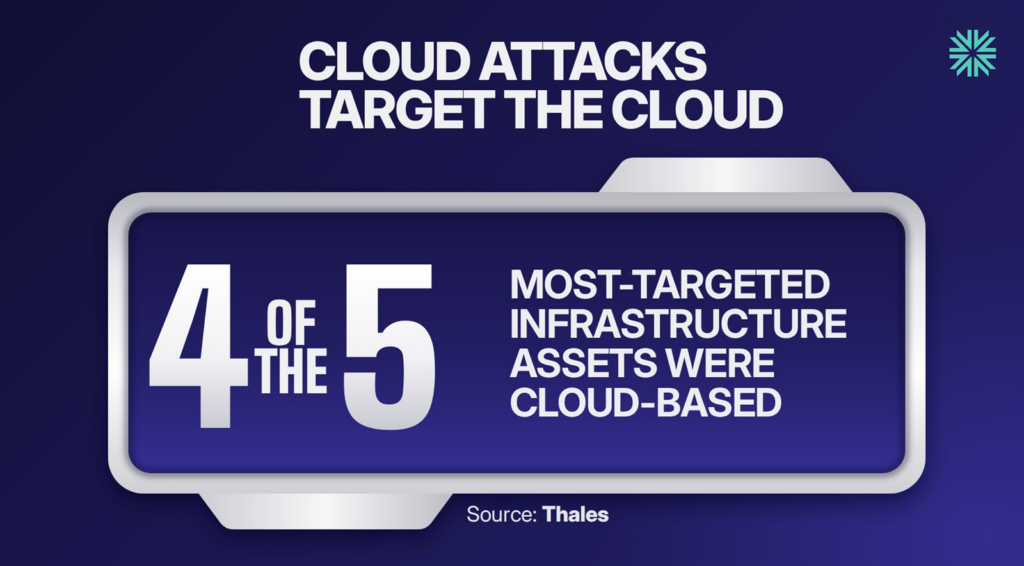
- Four of the five infrastructure assets most frequently targeted in reported attacks were cloud based. Thales
- Sixty-one percent of organizations used at least five tools for data discovery, monitoring, or classification. Thales
- Fifty-seven percent of organizations used at least five encryption key managers. Thales
- Access-based attacks were reported as a concern at 68% of organizations. Thales
- Eighty-five percent of organizations said at least 40% of their cloud data was sensitive. Thales
- Multifactor authentication was in place at 66% of organizations. Thales
- Misconfiguration caused 29.4% of Google Cloud incidents in the first half of 2025 and 21% in the second half. Google Cloud
- Threat actors used identity issues for initial access in 83% of major cloud and SaaS incidents examined during the second half of 2025. Google Cloud
- Data theft was the objective in 73% of cloud-related incidents examined during the second half of 2025. Google Cloud
Hyperconvergence’s cloud security statistics article contains more data on threats, controls, breaches, and security spending.
What the Cloud Server Data Means for IT Planning
Cloud server demand is rising across infrastructure, platforms, databases, containers, and AI services. Quarterly market growth reached 43%, while AWS, Microsoft, and Google retained most public cloud revenue.
Hybrid and multicloud designs remain common because organizations place workloads according to cost, data location, latency, security, and operational needs. Public cloud workload shares continue to rise, while repatriation remains part of normal workload placement.
Cloud cost control requires more than discounts. Budgets need workload ownership, unit metrics, forecasting, architecture reviews, commitment planning, and clear responsibility across cloud, FinOps, business, and software asset teams.
AI is changing cloud server demand through GPU capacity, inference services, data platforms, and Kubernetes. Security work remains centered on identity, sensitive data, configuration, access controls, and tool complexity.
Sources
- Synergy Research Group, Q2 Cloud Market
- Gartner, AI-Optimized IaaS Forecast
- Gartner, Sovereign Cloud IaaS Forecast
- Flexera, 2026 State of the Cloud Report
- FinOps Foundation, State of FinOps 2026
- Amazon, Q2 2026 Results
- Microsoft, Q4 Fiscal 2026 Results
- Alphabet, Q4 2025 Earnings Call
- Oracle, Q4 and Fiscal 2026 Results
- CNCF, 2025 Annual Cloud Native Survey
- AWS Global Infrastructure
- Google Cloud Locations
- Microsoft Azure Global Infrastructure
- Synergy Research Group, Hyperscale Capacity
- Thales, 2025 Cloud Security Study
- Google Cloud, Cloud Threat Horizons H1 2026
- Datadog, State of Containers and Serverless and State of Cloud Costs
- FinOps Foundation, State of FinOps 2026 Data Library
- Uptime Institute, Annual Outage Analysis 2026
- Palo Alto Networks Unit 42, Exposed Public Cloud Services Research
- AWS, Azure, and Google Cloud Compute Pricing Documentation
- Accenture and AWS, Moving onto the AWS Cloud Reduces Carbon Emissions
Editorial Note
Market estimates reflect each research firm’s definitions, methods, and reporting periods. Provider financial results follow different fiscal calendars and segment definitions. Cloud adoption figures come from named survey populations. Infrastructure counts can change as providers open or close regions, zones, and data centers. Readers should review the named source before using a statistic in a financial model, procurement document, or board report.
Cloud Server Statistics FAQs
1. What Percentage of Enterprise Workloads Run on Public Cloud Servers in 2026?
Enterprises run 54% of their workloads in public clouds in 2026. Flexera reported this figure from its survey of 753 cloud decision-makers and users, including 620 respondents from enterprises with more than 1,000 employees. The enterprise share increased from 52% one year earlier.
The result measures workloads reported by the survey population, not the percentage of all worldwide computing cycles. Small and midsize businesses reported a higher public cloud workload share of 63%.
2. How Much Are Organizations Expected to Spend on Cloud Infrastructure Services in 2026?
Worldwide end-user spending on public cloud IaaS is forecast to reach $287.35 billion in 2026. Gartner expects this server, storage, and networking infrastructure category to grow 29.3% from $222.17 billion in 2025.
Broader definitions produce larger totals. Synergy Research Group measured $500 billion in trailing 12-month cloud infrastructure service revenue through Q2 2026 because its category includes public IaaS, public PaaS, and hosted private cloud services. The $287.35 billion figure is the more precise answer for public cloud infrastructure itself.
3. What Percentage of Cloud Spending Is Wasted on Idle, Oversized, or Abandoned Server Resources?
Organizations estimate that 29% of their IaaS and PaaS spending is wasted in 2026. Flexera’s 753 respondents supplied this estimate, which rose after five consecutive years of decline.
The figure covers more than idle virtual machines. It can include oversized instances, abandoned resources, unattached storage, weak scheduling, inefficient architectures, and unused commitments. It is a self-reported estimate of avoidable spending, not an audited percentage of provider invoices or physical server capacity.
4. How Much Can Businesses Save Through Cloud Server Rightsizing and Committed-Use Pricing?
Committed-use pricing can cut eligible compute rates by as much as 72% compared with on-demand pricing, while rightsizing savings depend on each workload’s overprovisioning. AWS advertises up to 72% savings for EC2 Instance Savings Plans, Azure advertises up to 72% for reservations, and Google Cloud advertises up to 70% for some memory-optimized Compute Engine commitments and up to 55% for most other machine series.
These are maximum rate discounts, not guaranteed reductions in the total cloud bill. Rightsizing first lowers the amount of compute purchased. A commitment then lowers the rate on stable usage. Overcommitting can erase part of the benefit when demand falls or instance requirements change.
5. What Percentage of Organizations Operate Cloud Servers Across Multiple Public Cloud Providers?
About 71% of organizations in Flexera’s 2026 survey used multiple public clouds. This total combines the report’s architecture groups that used multiple public clouds alone, multiple public clouds with one private cloud, and multiple public clouds with multiple private clouds.
The broader multicloud rate is higher because Flexera defines multicloud as more than one cloud of any type, including multiple private clouds. The same survey found 73% used hybrid cloud, while 14% used multiple public clouds without any private cloud. The sample included 753 cloud decision-makers and users worldwide.
6. How Common Is Cloud Repatriation Among Companies That Previously Moved Server Workloads to Public Clouds?
Flexera’s 2026 respondents reported that 23% of their cloud-based workloads had been repatriated. That share increased 2 percentage points from 21% in the prior survey.
This statistic measures the portion of workloads moved back, not the portion of companies that repatriated at least one workload. No current study supplies a reliable worldwide percentage of companies with a repatriation project. The data supports selective workload movement within hybrid estates, not a broad exit from public cloud.
7. Which Workloads Are Most Frequently Moved From Cloud Servers Back to Private Infrastructure?
Stable, predictable, data-intensive, and tightly regulated workloads are the most common repatriation candidates, but no authoritative 2026 survey ranks them by worldwide migration count. Typical candidates include databases with heavy data-transfer charges, applications with steady high utilization, latency-sensitive systems, licensed legacy software, regulated data stores, and workloads that need specialized hardware.
Placement decisions remain workload-specific. Flexera found that comparing on-premises and cloud costs was a migration challenge for 43% of respondents. The same report recorded repatriation and migration at the same time, which supports ongoing placement reviews rather than a single direction of travel.
8. How Do Cloud Server Costs Compare With On-Premises Server Costs Over a Five-Year Period?
No universal five-year cost ratio exists because utilization, staffing, resilience, software licenses, data transfer, financing, and discount coverage can reverse the result. Public cloud usually avoids upfront hardware purchases and performs well for variable demand. Owned infrastructure can cost less for stable, highly utilized workloads when an organization already has facilities and operations staff.
Current benchmarks show the size of the possible swing. Flexera respondents estimate 29% cloud waste, while major providers advertise commitment discounts of up to 70% to 72% on eligible compute. A valid five-year comparison must model the same performance and availability target and include hardware refreshes, support, power, cooling, labor, network egress, backup, disaster recovery, and residual value.
9. What Percentage of Cloud Server Workloads Use ARM-Based Processors Rather Than x86 Processors?
There is no authoritative worldwide ARM share for all cloud server workloads. Cloud providers do not publish a combined architecture-level workload count, and managed services can hide the underlying processor from customers.
Datadog’s 2025 telemetry offers a useful scoped benchmark: ARM-based cloud instances represented 15% of the instances it observed, up from 9% two years earlier. ARM also ran 19% of observed AWS Lambda functions, up from 9%. These figures describe Datadog’s customer sample, not the entire cloud market. AWS separately reports that more than 120,000 customers have used Graviton processors.
10. How Quickly Is Demand Growing for GPU Cloud Servers Used for AI Training and Inference?
Worldwide AI-optimized IaaS spending is forecast to grow 96.4% to $42.28 billion in 2026. Gartner expects inference infrastructure spending to reach $23.3 billion and training infrastructure spending to reach $19.0 billion, making inference 55% of the category.
This forecast covers cloud infrastructure built around GPUs and other AI accelerators, not GPU unit shipments alone. Synergy Research Group also reported that generative AI-specific cloud services grew 165% year over year in Q2 2026. Both measures show demand rising much faster than the broader IaaS market, which Gartner expects to grow 29.3% in 2026.
11. What Percentage of Organizations Experience Unexpected Increases in Monthly Cloud Server Bills?
Seventeen percent of organizations exceeded their public cloud budgets during the year covered by Flexera’s 2026 survey. The report does not publish a separate worldwide percentage for an unexpected increase in a single monthly bill.
Budget pressure is broader than that overrun figure. Managing cloud costs was a challenge for 85% of respondents, and 30% named unpredictable costs as a leading problem when scaling AI workloads. The 17% rate is therefore the closest current measure of realized overspending, while the 85% and 30% figures measure concern rather than actual bill increases.
12. How Much Cloud Server Capacity Remains Unused During Normal Operating Periods?
No reliable worldwide percentage of unused cloud server capacity is public. Hyperscale providers do not disclose fleet-wide CPU, memory, GPU, and storage utilization, and customer reservation data does not reveal the provider’s underlying physical use.
Flexera’s estimate that 29% of IaaS and PaaS spending is wasted is the closest broad customer-side benchmark, but it is not a capacity-utilization figure. A virtual machine can waste money while using substantial CPU, and reserved physical capacity can serve another tenant. Capacity should be measured separately for CPU, memory, storage, accelerators, and time rather than expressed as one global percentage.
13. What Percentage of Cloud Outages Result From Configuration Errors, Software Failures, or Provider Infrastructure Problems?
No current dataset reports one worldwide cloud-only percentage for these overlapping causes. Provider infrastructure problems can include software, network, power, cooling, and change-management failures, while customer configuration errors sit on the customer side of the shared-responsibility model.
Uptime Institute reported that IT and networking issues caused 23% of impactful data center outages in 2024. Its 2026 analysis still lists power as the leading cause of impactful outages and reports growing fiber and connectivity failures. These results cover enterprise, colocation, hosting, and cloud infrastructure rather than public cloud servers alone, so 23% should not be presented as a cloud-provider outage rate.
14. How Much Revenue Can an Organization Lose During a Major Cloud Server Outage?
A major outage can cost more than $1 million, but revenue loss varies with transaction volume, recovery time, industry, and time of day. Uptime Institute’s 2026 analysis found that 57% of respondents said their most recent major outage cost more than $100,000, while 20% reported a cost above $1 million.
Those totals include lost revenue, staff time, recovery, service credits, penalties, and other effects across data center and IT outages. They are not cloud-only revenue figures. An organization should calculate its own exposure from revenue per minute, lost transactions, recovery costs, contractual penalties, and the portion of customers affected.
15. What Percentage of Cloud Security Incidents Involve Exposed Servers, Weak Access Controls, or Misconfigured Services?
No defensible combined percentage exists because these conditions overlap and incident studies use different denominators. Google Cloud’s H1 2026 Cloud Threat Horizons report found that identity issues provided initial access in 83% of the major cloud and SaaS incidents examined from the second half of 2025. Its incident analysis attributed 21% of that period’s Google Cloud compromises to misconfiguration, down from 29.4% in the first half of 2025.
The 83% and 21% figures must remain separate. One measures initial access across major cloud and SaaS response cases, while the other measures the cause of incidents in Google Cloud environments. Adding them would double-count cases and produce an invalid security rate.
16. How Frequently Are Publicly Accessible Cloud Servers Scanned or Attacked After Deployment?
Internet-facing cloud services can receive hostile traffic within minutes and sustained scanning within hours. In a controlled Unit 42 study, researchers deployed 320 deliberately exposed cloud honeypots that emulated SSH, RDP, SMB, and PostgreSQL services. Eighty percent were compromised within 24 hours, and every honeypot was compromised within one week.
The 2021 experiment is still one of the clearest deployment-to-compromise measurements, but it represents intentionally exposed honeypots, not fully secured production servers. Current scale remains high: GreyNoise recorded 2.75 million RDP crawler sessions across its global sensor network on April 7, 2026. Any public service should be treated as continuously scanned from the time it receives a public address.
17. What Percentage of Cloud Server Workloads Now Run Inside Containers Rather Than Traditional Virtual Machines?
There is no valid worldwide split between containers and virtual machines because containers often run inside cloud VMs. The two categories are therefore not mutually exclusive.
Datadog observed that organizations allocated about 35% of Amazon EC2 compute spending to instances that ran containers, up from 30% one year earlier. One quarter of the organizations in that sample allocated more than 75% of EC2 spending to container hosts. CNCF separately found that 82% of surveyed container users ran Kubernetes in production. These are adoption and spending benchmarks, not a global container workload share.
18. How Widely Are Spot Instances Used for Batch Processing, Development, AI, and Other Interruption-Tolerant Workloads?
No provider-neutral survey publishes a complete percentage of organizations using spot instances across AWS, Azure, and Google Cloud. The FinOps Foundation’s 2026 data provides a limited benchmark: 19% of respondents at the earliest, pre-crawl maturity stage already used spot instances, compared with 36% using commitment-based discounts.
That 19% is specific to the least mature FinOps segment and should not be treated as the overall adoption rate. Spot capacity is most suitable for checkpointed batch jobs, build and test fleets, rendering, distributed analytics, and fault-tolerant AI work. Adoption is constrained where interruption, capacity availability, licensing, or stateful processing creates operational risk.
19. What Percentage of Organizations Use Sovereign or Region-Restricted Cloud Servers to Meet Data Residency Requirements?
No current worldwide study reports the percentage of organizations already running sovereign or region-restricted cloud servers. Nutanix found that data sovereignty was a high priority or required consideration for 80% of respondents in its 2026 Enterprise Cloud Index, but priority is not the same as deployed use.
Spending forecasts show material adoption. Gartner expects worldwide sovereign cloud IaaS spending to reach $80.43 billion in 2026, up 35.6%, and expects sovereign services to shift 20% of current workloads from global to local cloud providers. These figures measure spending and workload movement, not the share of organizations.
20. How Much Electricity and Carbon Emissions Can Cloud Server Consolidation Save Compared With Underutilized Private Servers?
Cloud consolidation can reduce energy use by roughly 76% in an optimized comparison, while carbon reductions can reach 99% in favorable cases. A 2024 Accenture study commissioned by AWS found that optimized AWS workloads were up to 4.1 times as energy efficient as comparable on-premises workloads. A 4.1-to-1 efficiency ratio corresponds to about 76% less energy for the same work.
The same study estimated carbon reductions of up to 99% for optimized compute-heavy workloads and up to 93% for storage-heavy workloads. These are upper-bound results from representative AWS scenarios, not guaranteed savings for every migration. Actual results depend on hardware utilization, data center efficiency, regional electricity, workload design, data movement, and the retirement of displaced private equipment.
[…] VMs/storage). Exact cloud share is often included in VPS or by hyperscaler stats above. Our latest cloud server statistics explore market growth, provider trends, and broader cloud infrastructure […]