
As businesses rush to migrate and modernize, the cloud feels like magic- until it isn’t. When eight in ten companies report a serious cloud security incident, it’s clear how deeply the risks are woven into our everyday operations.
Cloud adoption continues to surge across sectors, and security professionals must understand how threats and vulnerabilities evolve in this environment. Multi‑cloud architectures, pervasive human error, advanced ransomware tactics, and regulatory pressures are shaping the security landscape.
Whether you’re a CIO eyeing multi‑cloud strategies or a developer shipping code at 2 a.m., safeguarding data is now everyone’s responsibility. This article compiles recent statistics from reputable reports and industry sources to provide a detailed overview of the state of cloud security from 2023 to 2025.
With 130 latest cloud security statistics, this analysis aims to help CISOs, cloud architects, and procurement leaders make data‑driven decisions without getting overwhelmed.
Let’s check them out!
Summary of Major Statistic Categories
- Global adoption and misconfiguration trends – cloud usage patterns, multi‑cloud adoption, misconfiguration rates, AI adoption in the cloud, and vulnerability persistence.
- Payment and breach costs – ransomware payment averages, breach cost differences across industries and regions, and payment rates.
- Ransomware and threat groups – prevalence of extortion groups, motivations, and top ransomware variants.
- Initial access vectors and tactics – how attackers gain entry (exploits, stolen credentials, phishing), human‑element statistics, and CVE proliferation.
- Industry‑level impacts – sector‑specific exposure of sensitive data, breach frequencies, and cost differentials.
- Regional breakdowns – geographical patterns in breaches, resilience, and confidence levels.
- Major breaches and highest payments – notable ransom demands, payment ranges, and largest breaches.
- Cost impact and recovery patterns – average recovery times, operational disruptions, and recovery success rates.
- Human impact and skills gap – staffing shortages, training deficiencies, and the burden on engineering teams.
- Timeline shifts – year‑over‑year changes in exploit prevalence, payment rates, and vulnerability disclosure volumes.
Global Trends
Cloud Adoption and Multi‑Cloud Patterns
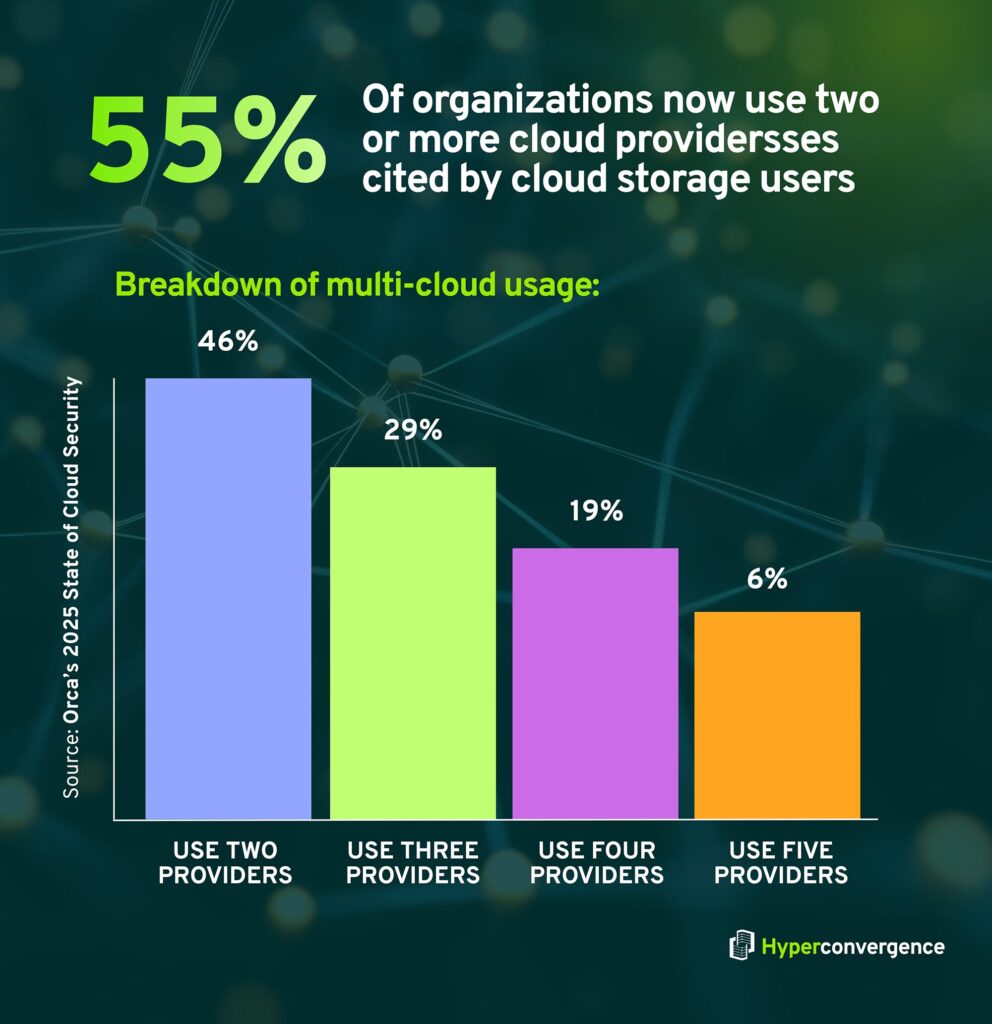
- Multi‑cloud adoption is now mainstream; 55% of organizations use two or more cloud providers, up from 12% in the 2024 survey, and only <1% use a single provider. (Orca’s 2025 State of Cloud Security)
- 46% of organizations use two providers, 29% use three, 19% use four, and 6% use five, with only 1% relying on one. (Orca’s 2025 State of Cloud Security)
- Provider market share remains concentrated: 82% use AWS, 54% use Microsoft Azure, 35% use Google Cloud Platform, 10% use Oracle Cloud, and 1% use Alibaba Cloud. (Orca’s 2025 State of Cloud Security)
- 84% of organizations use AI services in the cloud, but 62% have at least one vulnerable AI package, and 93% have at least one privileged Kubernetes service account. (Orca’s 2025 State of Cloud Security)
- 84% of organizations operate more than one AWS account, and 86% use AWS Organizations, yet only 40% of those use service control policies (SCPs) and 6% use resource control policies (RCPs). (DataDog)
- 70% of organizations have all AWS accounts in a single organization, but 14% still do not use AWS Organizations. (DataDog)
- 79% of organizations use federated authentication for AWS console access, but 39% still use IAM users, with 20% relying solely on IAM users; 59% of IAM users have an active access key older than one year. (DataDog)
- Multi‑cloud adoption challenges: 56% of respondents struggle to secure data across multiple clouds, and 69% find it hard to maintain consistent controls, while 45% lack sufficient staff to manage multi‑cloud security. (Exabeam Cloud Security Statistics 2025)
- 83% of organizations consider cloud security a major concern. (Exabeam Cloud Security Statistics 2025)
- The cloud security market was $20.54 billion in 2022 and is projected to reach $148.3 billion by 2032, reflecting a compound annual growth rate of over 21%. (Exabeam Cloud Security Statistics 2025)
- 97% of enterprise cloud applications are unsanctioned, creating significant blind spots for security teams. This widespread shadow IT problem is a key driver behind the surge in cloud security incidents affecting organizations worldwide. (Brightlio )
Misconfigurations, Vulnerabilities, and Exposures
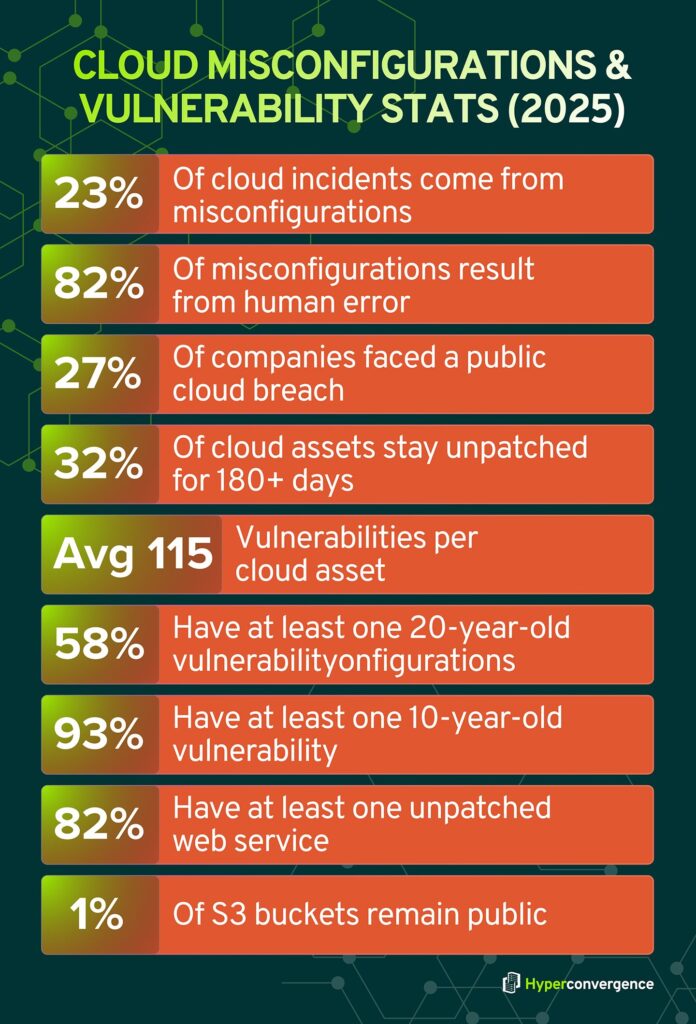
- Misconfigurations continue to be a major risk: 23% of cloud incidents originate from misconfigurations, and 82% of these are due to human error. (Exabeam Cloud Security Statistics 2025)
- 27% of companies have suffered public‑cloud breaches, underscoring how misconfigurations often expose data. (Exabeam Cloud Security Statistics 2025)
- 32% of cloud assets are neglected, meaning they remain unpatched for over 180 days, and each asset contains, on average, 115 vulnerabilities. (Orca’s 2025 State of Cloud Security)
- 58% of organizations have at least one vulnerability older than 20 years, and 93% have at least one vulnerability older than 10 years. (Orca’s 2025 State of Cloud Security)
- 82% of organizations have at least one unpatched web service, including 87% of healthcare organizations and 84% of technology companies. (Orca’s 2025 State of Cloud Security)
- Only 49% of AWS EC2 instances enforce IMDSv2 (Instance Metadata Service version 2), though this is an improvement from 32% in 2024; 37% of organizations enforce IMDSv2 on all instances, while 24% enforce it on fewer than 20% of instances. (DataDog)
- 1% of S3 buckets remain effectively public, down from 1.5% a year earlier; 83% of buckets now have a public access block, up from 79% in 2024 and 73% in 2023. (DataDog)
- In Microsoft Azure, 1.3% of Blob containers are public, down from 2.6%, and 58% of Blob containers are in accounts that proactively block public access. (DataDog)
- 12.2% of third‑party integration IAM roles are over‑privileged, and 2.25% of such roles don’t enforce an external ID, exposing organizations to supply‑chain compromise. (DataDog)
- 19.4% of AWS EC2 instances are over‑privileged, with 3.8% allowing lateral movement and 2.4% allowing privilege escalation; in Google Cloud, 23% of virtual machines have over‑permissive roles, including 17% with full admin access. (DataDog)
- 39% of Amazon EKS clusters, 34% of Azure AKS clusters, and 54% of Google GKE clusters expose their API servers to the internet; 13% of EKS clusters have a node role enabling full admin access or lateral movement; 10% of GKE clusters have privileged service accounts. (DataDog)
- 9% of cloud storage resources contain restricted or confidential information, 54% of organizations using AWS ECS embed secrets in task definitions, and 3.5% of AWS EC2 instances store credentials in user data, providing attackers with immediate environment access. (Cybersecurity Asia- Tenable’s 2025 Cloud Security Risk Report)
- 72% of respondents report an increase in organizational cyber risks, while only 37% have formal processes to assess AI tools for security. (World Economic Forum Global Cybersecurity Outlook)
- Zero‑day exploitation surged; the Verizon DBIR 2024 observed a 180% increase in vulnerability exploitation as an initial path to compromise, driven by incidents such as the MOVEit supply‑chain breach. (Verizon 2024 Data Breach Investigations Report)
- 38% of vulnerabilities disclosed in early 2025 were rated high or critical, with 1,773 critical CVEs and 6,521 high‑severity CVEs among more than 21,500 CVEs reported in the first half of 2025. (DeepStrike 2025 Vulnerability Statistics)
Data Exposure and Sensitive Information
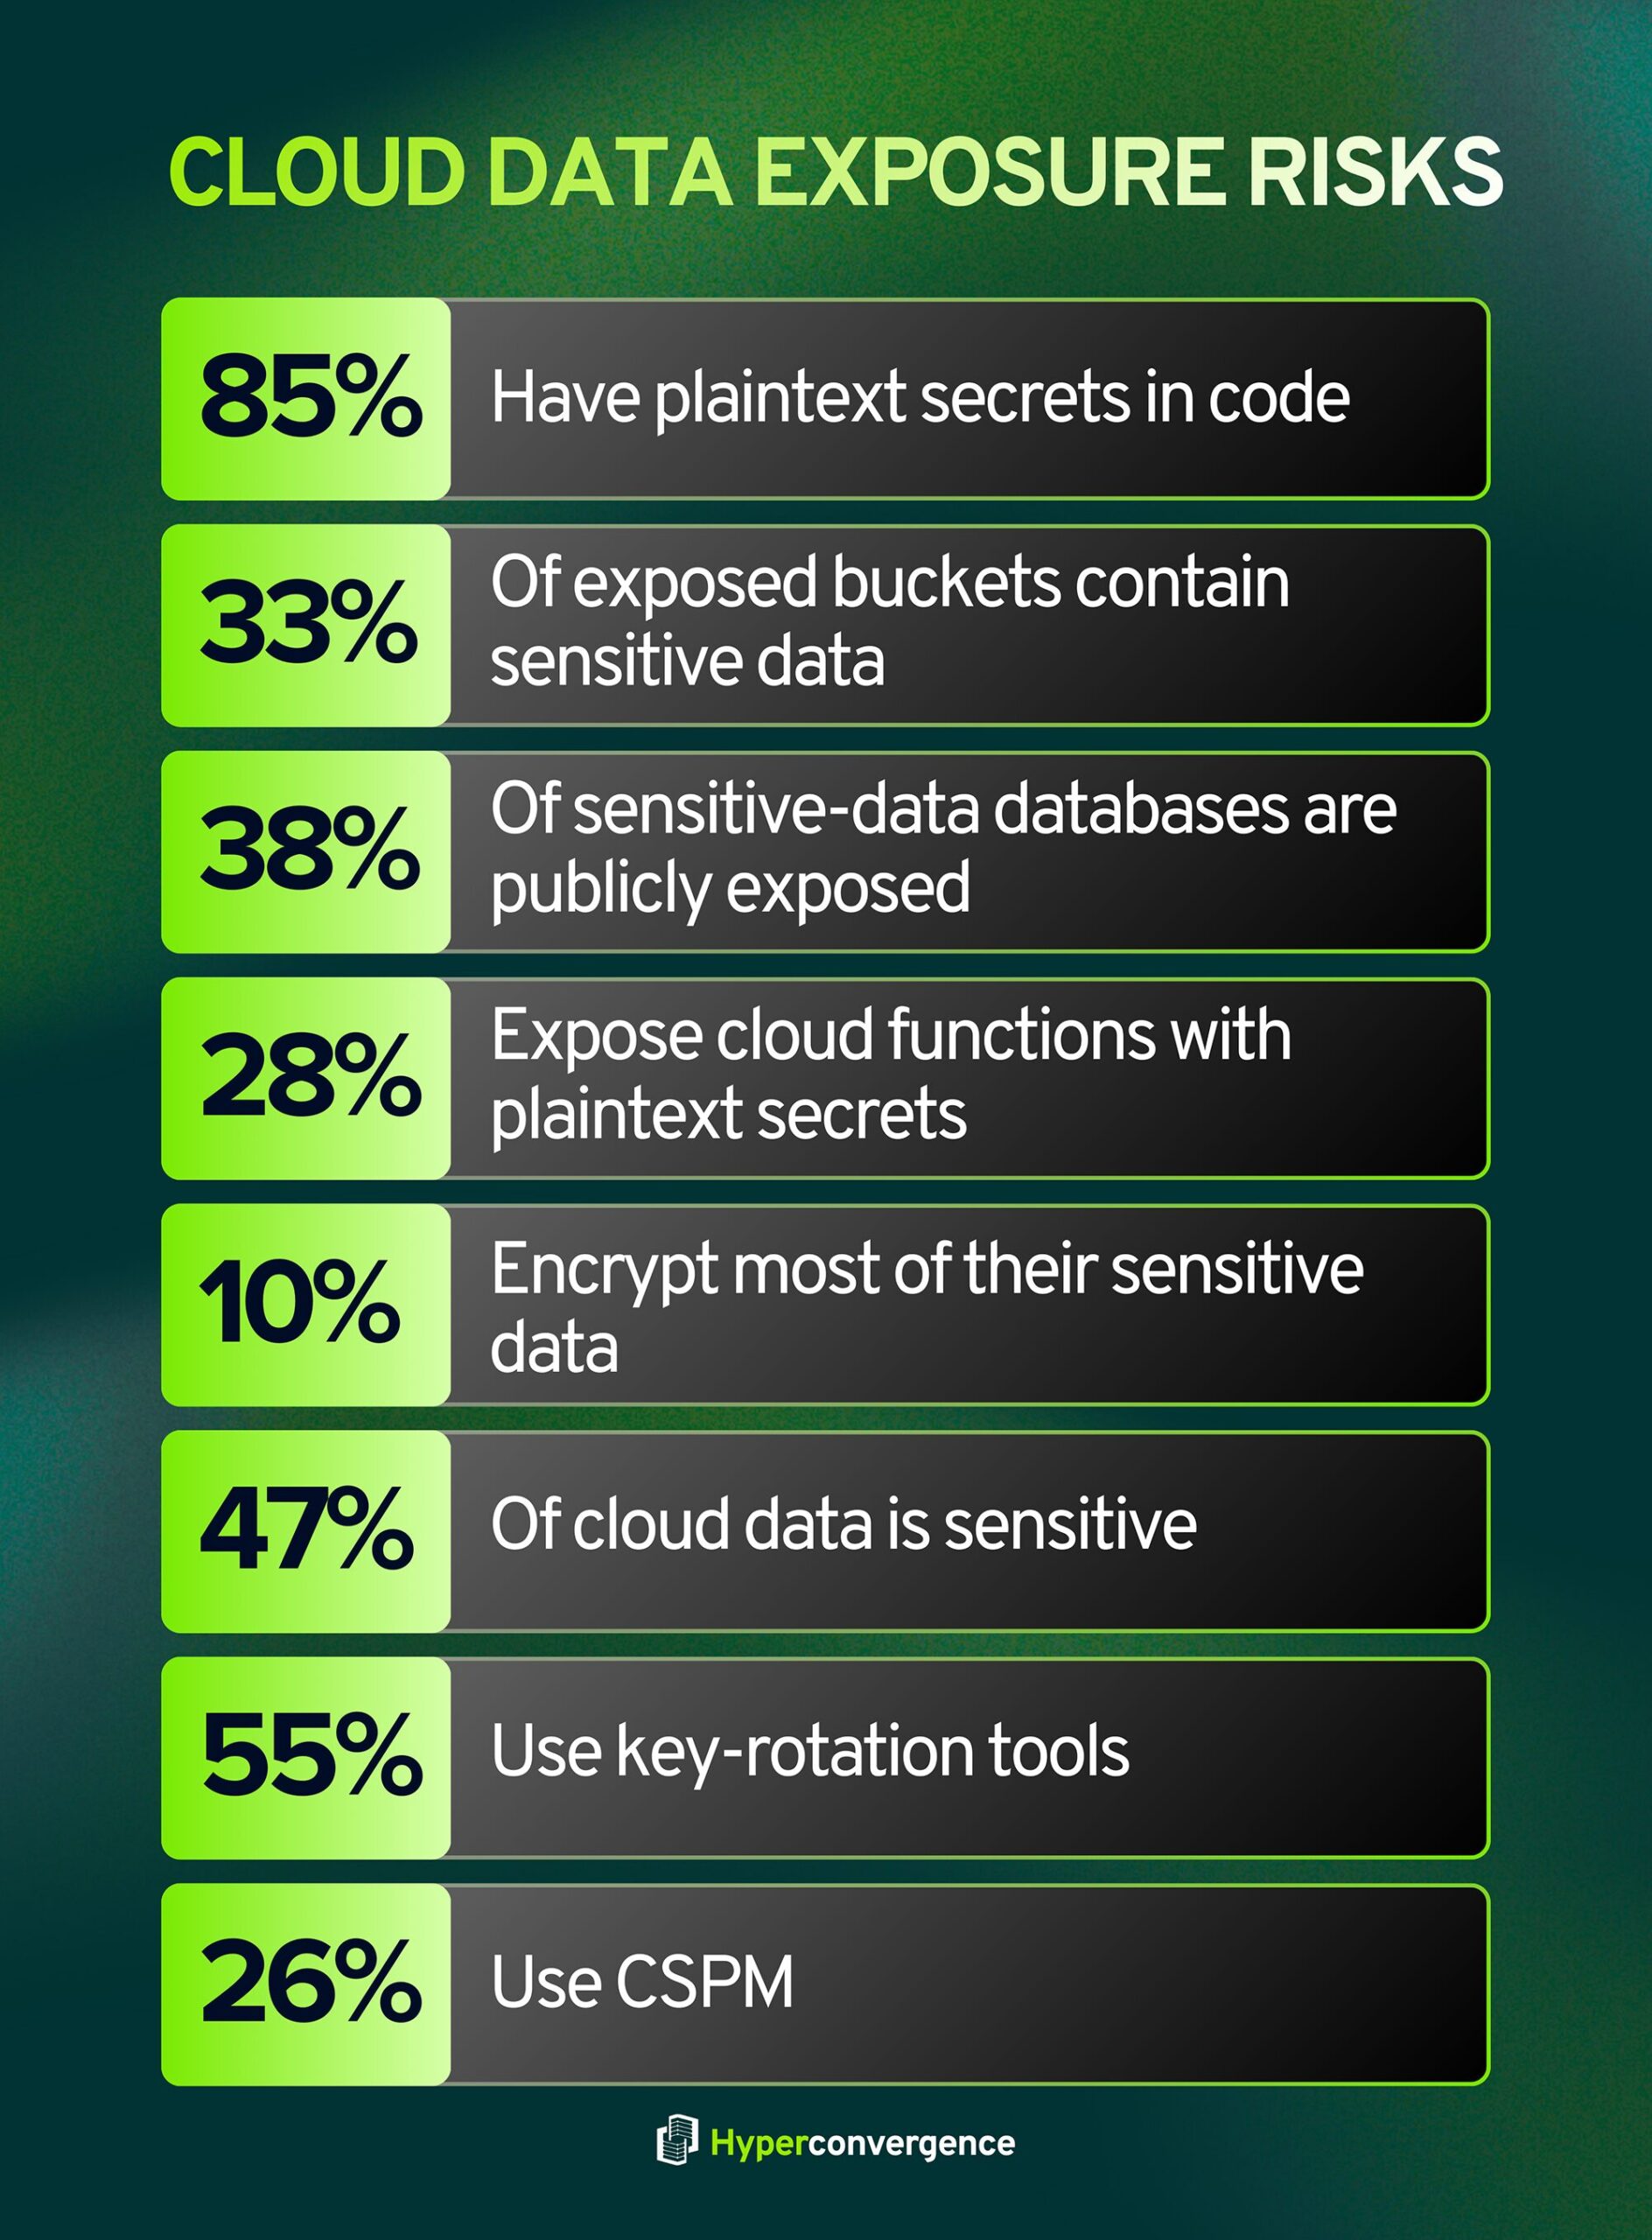
- 85% of organizations have plaintext secrets in source‑code repositories, and 33% of organizations with exposed storage buckets store sensitive data there. (Orca’s 2025 State of Cloud Security)
- 38% of organizations with sensitive data in databases also have those databases exposed to the public. (Orca’s 2025 State of Cloud Security)
- Across industries, exposures vary: 26% of healthcare organizations with publicly exposed storage buckets store sensitive data, while the technology industry sees 51% of exposed databases containing sensitive information. (Orca’s 2025 State of Cloud Security)
- 28% of organizations with cloud functions expose publicly accessible functions containing plaintext secrets. (Orca’s 2025 State of Cloud Security)
- Less than 10% of companies encrypt more than 80% of their sensitive cloud data, even though 47% of cloud‑resident data is sensitive. (Exabeam Cloud Security Statistics 2025)
- 55% of companies use encryption key rotation tools, and only 26% deploy cloud‑security posture management solutions (CSPM). (Exabeam Cloud Security Statistics 2025)
Incident Prevalence and Breach Trends
- 80% of companies experienced a serious cloud‑security issue in 2023, and over 60% reported a public‑cloud–related security incident in 2024. (Exabeam Cloud Security Statistics 2025)
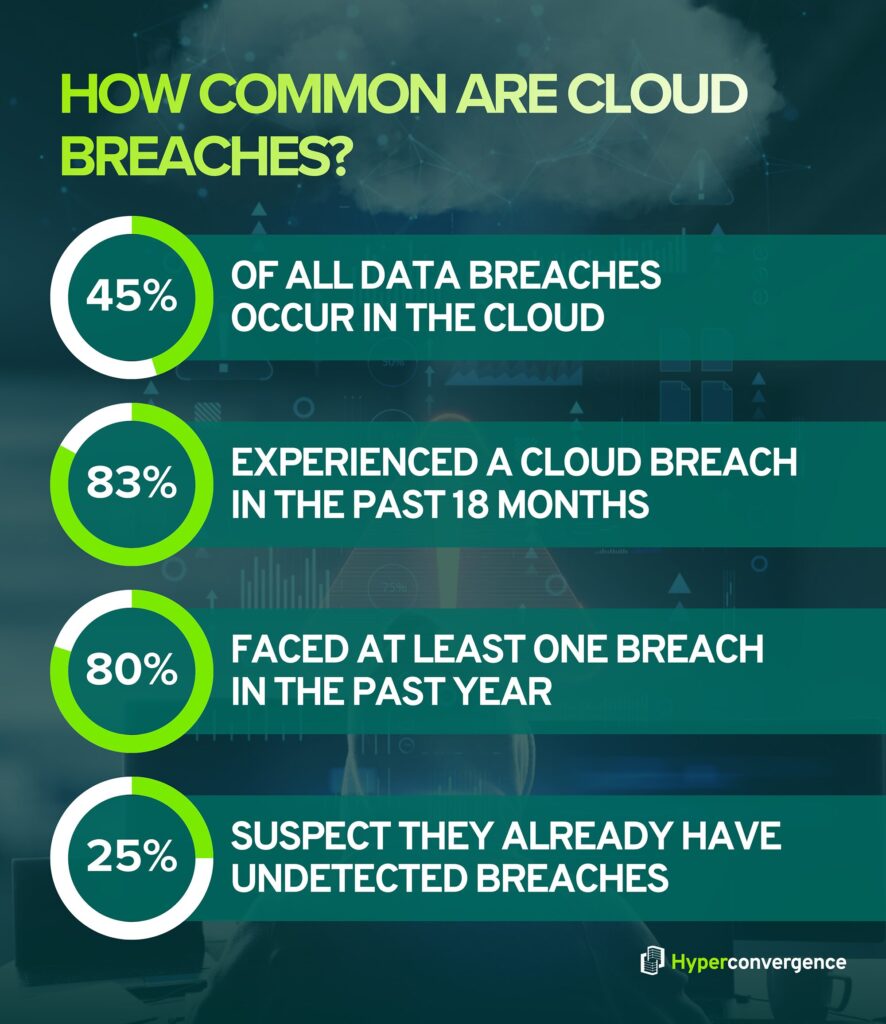
- 45% of data breaches occur in the cloud, and 83% of organizations suffered a cloud breach in the past 18 months. (Exabeam Cloud Security Statistics 2025)
- 80% of organizations faced at least one breach in the past year, and 82% attribute breaches to a lack of visibility in hybrid environments. (Exabeam Cloud Security Statistics 2025)
- 25% of respondents fear they have undetected breaches. (Exabeam Cloud Security Statistics 2025)
- 82% of data breaches involved data stored in the cloud, and cloud environment intrusions increased 75% from 2022 to 2023. (The SANS Cloud Security Exchange 2024)
- 99% of cloud security failures by 2025 will result from customer configuration mistakes. (The SANS Cloud Security Exchange 2024)
- 30,458 incidents and 10,626 confirmed breaches, with 68% of breaches involving the human element. (Verizon 2024 Data Breach Investigations Report)
- 15% of breaches involved supply‑chain interconnection, representing a 68% year‑over‑year increase, and errors (misconfigurations) accounted for 28% of breaches. (Verizon 2024 Data Breach Investigations Report)
- 83% of developers expect cloud security risks to increase, according to PwC research (cited by Exabeam). (Exabeam Cloud Security Statistics 2025)
Payment Trends
- The average total cost of a ransomware breach was $4.88 million in 2024, according to IBM’s Cost of a Data Breach report (cited by Halcyon). (Halcyon Ransomware Statistics)
- Small businesses incur ransomware costs ranging from $120,000 to $1.24 million. (Halcyon Ransomware Statistics)
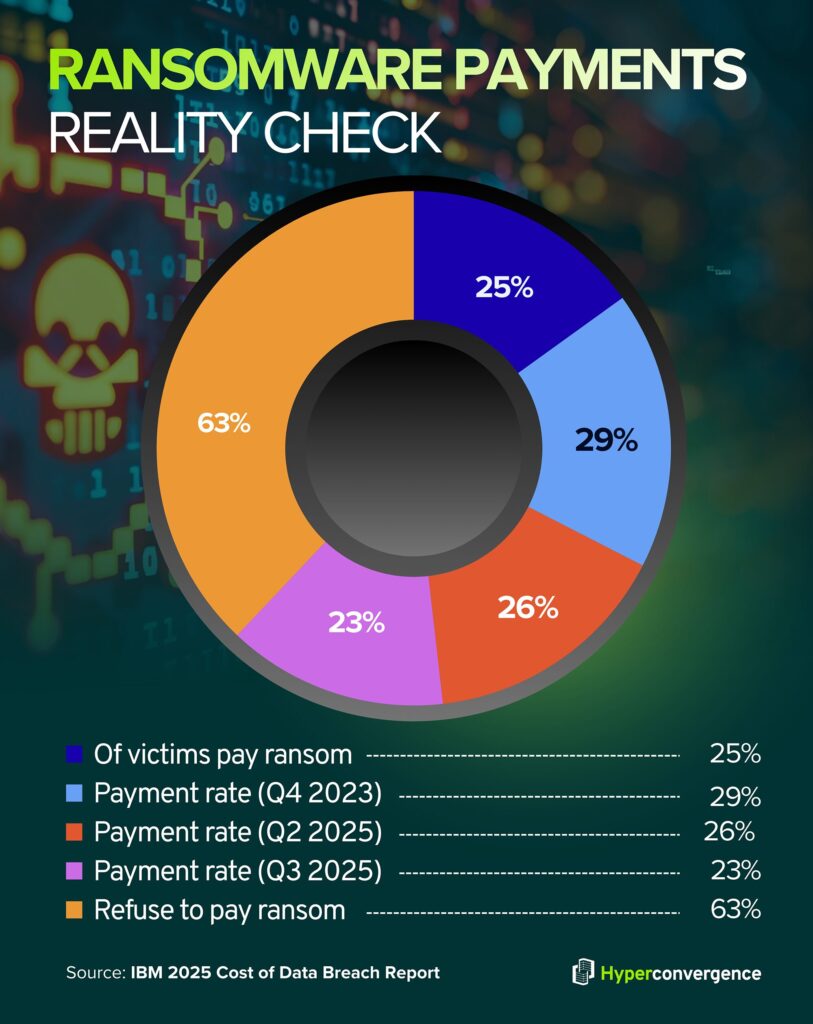
- An average ransom payment of $568,705 (−33% from Q3 2023), with a median payment of $200,000, and a payment rate of 29%. (Coveware’s Q4 2023 Report)
- The average ransom payment surged to $1,130,070 (+104% quarter‑over‑quarter), and the median climbed to $400,000, yet the overall payment rate was only 26%, reflecting the continuing unwillingness of victims to pay. (Coveware’s Q2 2025 Report)
- The average payment fell to $376,941 (−66% from Q2), with a median of $140,000; the overall payment rate dropped to 23%, and payment rates for exfiltration‑only incidents fell to 19%, marking record lows. (Coveware’s Q3 2025 Report)
- Exfiltration occurred in 74% of cases in Q2 2025 and 76% in Q3 2025, while lateral movement occurred in 60% and 73% of cases, respectively. (Coveware)
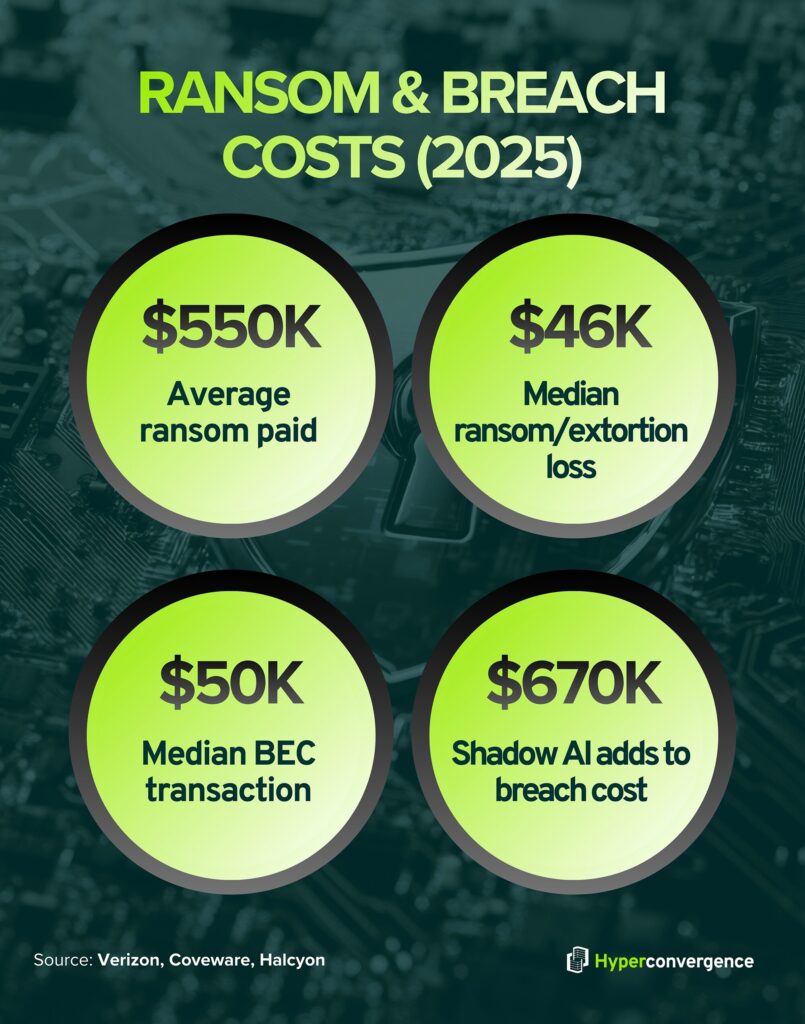
- The average ransom demand is $3.5 million, but the average ransom paid is about $550,000, and only 25% of victims pay any ransom. (Halcyon Ransomware Statistics)
- The global average cost of a data breach fell to $4.44 million in 2025, down from $4.88 million in 2024. (All Covered IBM 2025 Cost of Data Breach Report)
- In the U.S., however, the average breach cost increased to $10.22 million, a 9% rise. (All Covered IBM 2025 Cost of Data Breach Report)
- Ransomware or extortion incidents cost victims an average of $5.08 million, and 63% of victims refuse to pay ransom. (All Covered IBM 2025 Cost of Data Breach Report)
Common Ransomware or Threat Groups
- 55% of threat groups active in 2024 were financially motivated, up from 52% in 2023 and 48% in 2022. (Mandiant 2025 M-Trends Report)
- Only 8% of groups were motivated by espionage, a decline from 10% in 2023. (Mandiant 2025 M-Trends Report)
- The top industries targeted in Mandiant’s investigations were financial services (17.4%), business and professional services (11.1%), high tech (10.6%), government (9.5%), and healthcare (9.3%). (Mandiant 2025 M-Trends Report)
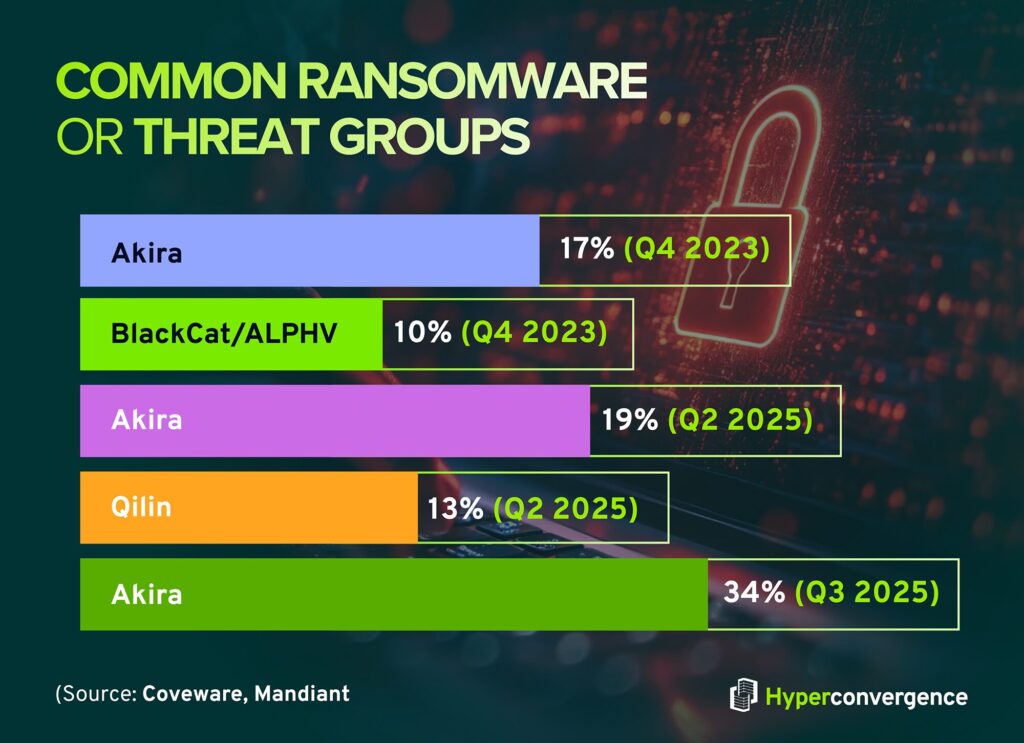
- Akira (17%) and BlackCat/ALPHV (10%) are the most prevalent ransomware families. (Coveware’s Q4 2023 Data)
- Akira is responsible for 19% of incidents, and Qilin for 13%. (Coveware’s Q2 2025 Report)
- By Q3 2025, Akira’s market share increased to 34%, followed by Qilin; new families used extortion only methods. (Coveware)
- 85 active extortion groups in Q3 2025, and the top 10 groups accounted for 56% of victims, down from 71% in Q1. (Check Point Research- The State of Ransomware – Q3 2025)
- 1,592 new victims listed on leak sites in Q3 2025, roughly 520–540 victims per month, a 25% increase over Q3 2024. (Check Point Research- The State of Ransomware – Q3 2025)
- Fourteen new extortion groups began publishing victims in Q3 2025, and 45 new groups emerged in 2025. (Check Point Research- The State of Ransomware – Q3 2025)
- The leading group, Qilin, averaged 75 victims per month, while INC Ransom averaged 39 victims, and Play averaged 33. (Check Point Research- The State of Ransomware – Q3 2025)
- Payment rates for extortion attacks are estimated at 25–40% of cases. (Check Point Research- The State of Ransomware – Q3 2025)
Initial Access Methods and Attacker Tactics
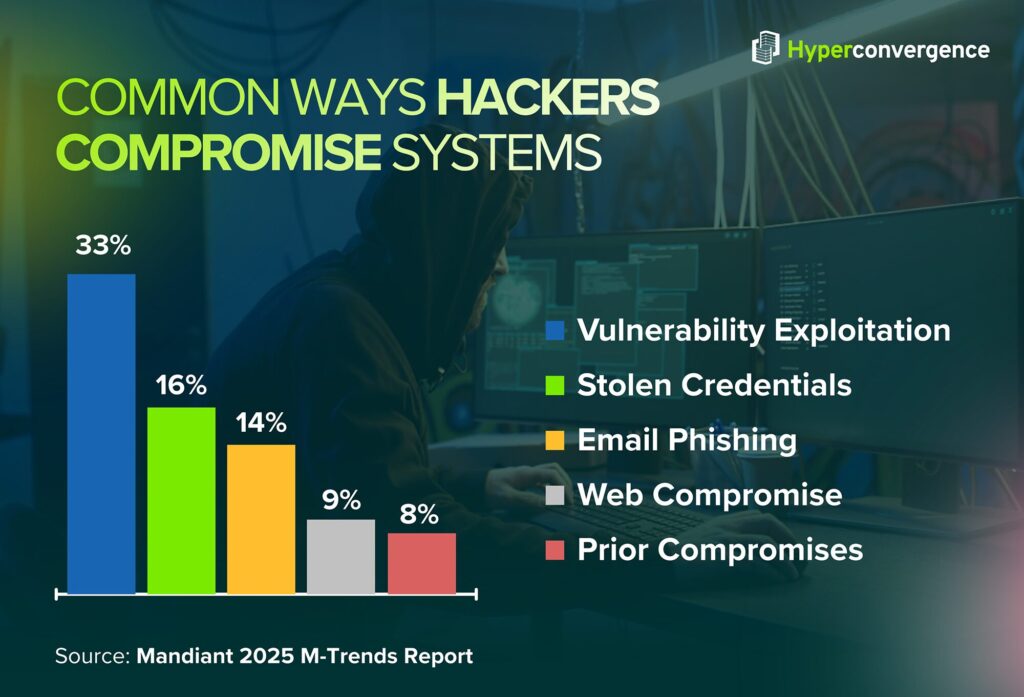
- Exploitation of vulnerabilities accounted for 33% of initial compromises, followed by stolen credentials (16%), email phishing (14%), web compromise (9%), and prior compromises (8%). (Mandiant 2025 M-Trends Report)
- 68% of breaches involve the human element, including phishing, stolen credentials, and misconfigurations. (Verizon 2024 Data Breach Investigations Report)
- The median time for a user to click on a phishing email is 21 seconds, with an additional 28 seconds to enter data, underscoring how quickly attackers can harvest credentials. (Verizon 2024 Data Breach Investigations Report)
- Supply‑chain exploitation is rising; 15% of breaches involved supply‑chain interconnection, a 68% increase year‑over‑year, and errors (misconfigurations) contributed to 28% of breaches. (Verizon 2024 Data Breach Investigations Report)
- A global median dwell time of 11 days was recorded in 2024 (up from 10 days in 2023), but dwell time jumps to 26 days when detected by external parties and drops to 5 days when adversaries themselves notify victims. (Mandiant 2025 M-Trends Report)
- Remote access compromise was the most common initial access vector, and lateral movement occurred in 60% of incidents. (Coveware’s Q2 2025 Data)
- In Q3 2025, remote access compromise accounted for more than half of incidents, lateral movement occurred in 73%, and exfiltration occurred in 76%. (Coveware)
- Encryption was confirmed in 90% of Q2 2025 cases, indicating that attackers continue to encrypt data, even when they primarily rely on exfiltration. (Coveware)
- Zero‑day exploits against edge devices jumped to 22% of exploitation incidents, up from 3% the previous year, due to high‑profile vulnerabilities (DeepStrike 2025 Vulnerability Statistics referencing DBIR findings)
- 94% of organizations report API‑related security issues, and 52% cite insecure interfaces as a major threat, while 55% of HTTP malware downloads originate from cloud apps (Exabeam Cloud Security Statistics 2025)
- 25% of breaches arise from phishing, and 69% of organizations report phishing‑based identity incidents. (Exabeam Cloud Security Statistics 2025)
- 80% of breaches involve compromised privileged credentials, and 29% of ransomware infections start via file downloads or email attachments. (Exabeam Cloud Security Statistics 2025)
Industry‑Level Impacts
Sector‑Specific Exposure and Costs
- The healthcare sector is both highly targeted and vulnerable: 87% of healthcare organizations have at least one unpatched web service, and 26% of healthcare organizations with publicly exposed storage buckets store sensitive data. (Orca Security 2025 State of Cloud Security)
- Healthcare remains the costliest sector to breach at $7.42 million, although this is down from $9.77 million the prior year. (All Covered IBM 2025 Cost of Data Breach Report)
- In manufacturing, 29% of organizations with publicly exposed storage buckets contain sensitive data, and 38% of those with sensitive data in databases have public exposure. (Orca Security 2025 State of Cloud Security)
- Technology organizations have the highest function exposure: 49% of publicly exposed cloud functions in technology companies contain plaintext secrets. (Orca Security 2025 State of Cloud Security)
- Financial services is the most targeted sector, representing 17.4% of cases, with professional services, high tech, and government following. (Orca Security 2025 State of Cloud Security)
- Manufacturing and business services are the most affected by ransomware, while healthcare accounts for about 8% of extortion victims. (Check Point Research- The State of Ransomware – Q3 2025)
- Exfiltration‑only incidents remain stubbornly high, suggesting attackers increasingly target intellectual property and regulated data. (Coveware)
- 35% of small organizations believe their cyber resilience is inadequate, a sevenfold increase since 2022. In contrast, large organizations reporting insufficient resilience halved over the same period. (World Economic Forum Global Cybersecurity Outlook)
- 38% of public-sector organizations report inadequate cyber resilience, compared to 10% of private-sector organizations, and 49% report lacking necessary talent, an increase of 33% since 2024. (World Economic Forum Global Cybersecurity Outlook)
- 54% of large organizations cite supply‑chain challenges as the biggest barrier to cyber resilience, and 60% say geopolitical tensions influence their cybersecurity strategies. (World Economic Forum Global Cybersecurity Outlook)
Financial Impacts by Industry
- Financial services breaches cost on average $5.90 million, second only to healthcare; energy sector breaches cost $5.04 million; and industrial manufacturing incurs $4.73 million per breach. (IBM Cost of a Data Breach 2025 summary)
- Supply‑chain compromise breaches cost $4.91 million on average and take 267 days to resolve. (IBM Cost of a Data Breach 2025 summary)
- Breaches involving phishing as the initial vector cost $4.8 million and account for 16% of breaches. (IBM Cost of a Data Breach 2025 summary)
- Ransomware/extortion incidents cost $5.08 million on average and last 279 days. (IBM Cost of a Data Breach 2025 summary)
- Intellectual property loss is the most expensive type of data loss at $178 per record, while customer personally identifiable information (PII) is compromised in 53% of breaches. (IBM Cost of a Data Breach 2025 summary)
- 86% of organizations report operational disruptions post‑breach, and 45% raise prices to offset costs (down from 63% the previous year) (IBM Cost of a Data Breach 2025 summary)
- Only 35% of organizations fully recover from a breach, but this is up from 12% in prior years; most take over 100 days, and 25% take more than 150 days to recover. (IBM Cost of a Data Breach 2025 summary)
Regional and Country‑Level Breakdowns
- The United States recorded an average breach cost of $10.22 million in 2025, more than double the global average. (IBM Cost of a Data Breach 2025 summary)
- 97% of AI‑related breaches occurred in organizations without AI access controls, and 63% of organizations lack AI governance policies, highlighting a governance gap that is global. (IBM Cost of a Data Breach 2025 summary)
- Europe and North America show relatively higher confidence: only 15% of respondents lack confidence in their country’s ability to respond to a major cyber incident, versus 36% in Africa and 42% in Latin America (World Economic Forum Global Cybersecurity Outlook 2025)
- South Korea entered the top 10 attacked countries in Q3 2025, demonstrating that ransomware actors are expanding into new regions. (Check Point Research- State of Ransomware Q3 2025)
- Remote access compromise and social engineering are common across all regions, but payment rates vary; large enterprises in North America increasingly refuse to pay, leading to lower average ransom values. (Coveware)
- The public sector globally experiences a 49% shortage in cybersecurity talent, and 76% of CISOs worldwide say that fragmentation of regulations across jurisdictions makes compliance difficult. (World Economic Forum Global Cybersecurity Outlook 2025)
- 66% of organizations expect AI to impact cybersecurity significantly, but adoption readiness varies widely; only 37% have processes to assess AI tools, with lower readiness in developing economies. (World Economic Forum Global Cybersecurity Outlook 2025)
Major Breaches and the Highest Payments
- The average ransom demand is $3.5 million, and the average ransom paid is $550,000, illustrating the gap between demands and actual payments. (Halcyon Ransomware Statistics)
- The largest payment in Q2 2025 exceeded several million dollars, while the median payment was $400,000, indicating a skewed distribution. (Coveware)
- The median loss in combined ransomware/extortion breaches is $46,000, with a 95% range from $3 to $1.14 million. (Verizon 2024 Data Breach Investigations Report)
- Business email compromise (BEC) median transaction values were $50,000, underscoring how social engineering attacks can yield significant payoffs. (Verizon 2024 Data Breach Investigations Report)
- The average ransom payments have declined year over year, matching Coveware’s observation that payment rates are at record lows (~23%). (Coveware)
- The shadow AI usage adds about $670,000 to the cost of a breach, and 20% of breaches involve shadow AI, emphasising the importance of governance. (IBM Cost of a Data Breach 2025 summary)
Cost Impact and Recovery Patterns
- The global average cost of a data breach fell to $4.44 million in 2025, a 9% decrease from 2024. (IBM Cost of a Data Breach 2025 summary)
- Ransomware/extortion remains costly: $5.08 million average cost, and victims require 279 days to detect and contain incidents. (IBM Cost of a Data Breach 2025 summary)
- The average cost of a phishing‑driven breach is $4.8 million, while supply‑chain breaches cost $4.91 million and take 267 days to resolve. (IBM Cost of a Data Breach 2025 summary)
- 86% of IT leaders report losses exceeding $500,000 due to cloud account hijacking, and 33% of companies prioritize cloud security spending to manage these losses. (Exabeam Cloud Security Statistics 2025)
- The average cost of a data breach is $4.35 million, and 45% of breaches lead to exposure of personally identifiable information (PII). (Exabeam Cloud Security Statistics 2025)
- Downtime and productivity loss were cited as common outcomes, with 45% of organizations raising prices and 86% experiencing operational disruption after breaches. (IBM Cost of a Data Breach 2025 summary)
- Recovery remains challenging: only 35% of organizations report full recovery, while 25% need more than 150 days. (IBM Cost of a Data Breach 2025 summary)
- The payment rates continue to decline, and large enterprises often refuse to pay, which discourages attackers and may reduce overall ransom demands. (Coveware’s Q3 2025 Data)
Human Impact and Skills Gap
- The talent gap is severe: 71% of organizations report a shortage of cloud security professionals, and 77% cite poor training and collaboration between developers and security teams. (Exabeam Cloud Security Statistics 2025)
- 91% of respondents worry about zero‑day vulnerabilities, and 45% say cloud security consumes significant engineering resources. (Exabeam Cloud Security Statistics 2025)
- 54% of organizations struggle with compliance, and 49% of engineers think they’re responsible for cloud security, while only 19% of security teams agree, illustrating misaligned ownership. (Exabeam Cloud Security Statistics 2025)
- The cyber skills gap has increased 8% since 2024, and two‑thirds of organizations now report moderate‑to‑critical skills shortages. (World Economic Forum Global Cybersecurity Outlook 2025)
- Only 14% of organizations are confident they have the necessary talent to respond to a cyber incident, leaving most teams underprepared. (World Economic Forum Global Cybersecurity Outlook 2025)
- Weaker governance is evident: 63% of organizations lack AI governance policies, and 20% of breaches involve shadow AI, adding high cost. (IBM Cost of a Data Breach 2025 summary)
- 63% of organizations lack data sovereignty policies, and 55% say data privacy is one of their biggest challenges, according to Palo Alto Networks and Thales (cited by Exabeam) (Exabeam Cloud Security Statistics 2025)
Timeline Shifts and Year‑Over‑Year Trends
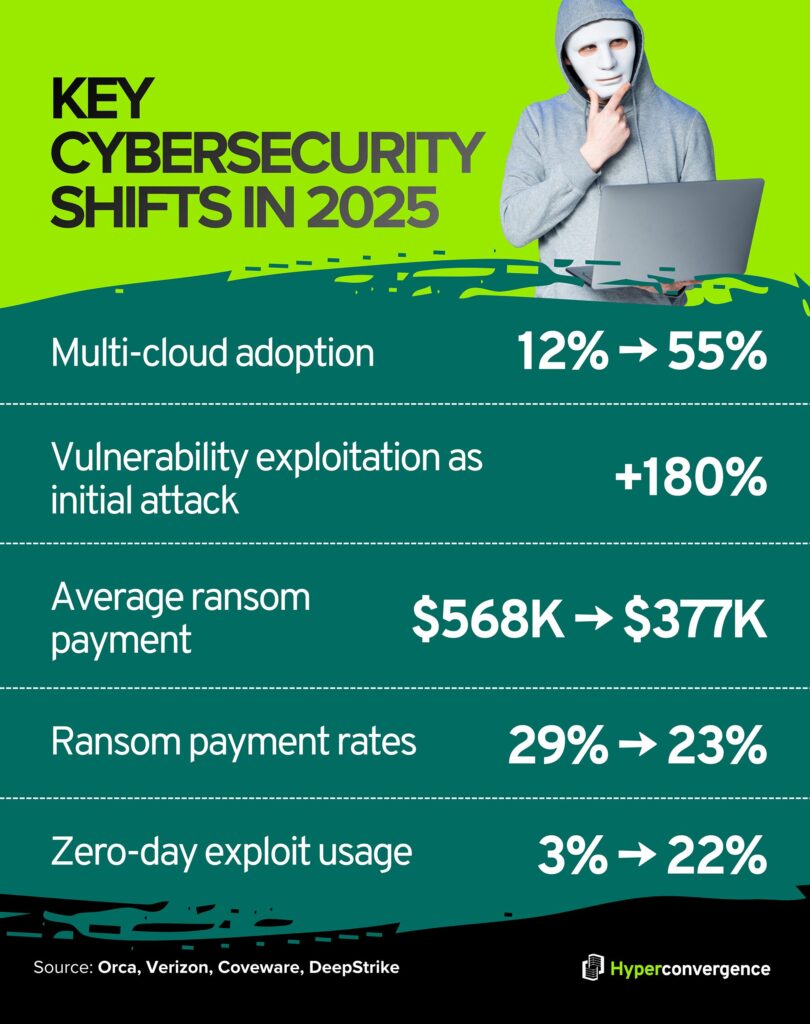
- Multi‑cloud adoption jumped from 12% in 2024 to 55% in 2025, reflecting rapid architectural diversification. (Orca’s 2025 State of Cloud Security Report)
- Vulnerability exploitation as an initial attack vector increased 180% year over year due to high‑profile vulnerabilities like MOVEit. (Verizon 2024 Data Breach Investigations Report)
- Average ransom payments dropped from $568,705 in Q4 2023 to $376,941 in Q3 2025, while the median payment decreased from $200,000 to $140,000, illustrating downward pressure from non‑payment. (Coveware)
- Payment rates fell from 29% in Q4 2023 to 23% in Q3 2025, demonstrating growing resistance to extortion demands. (Coveware)
- Exploitation of zero‑days rose sharply: 22% of exploitation incidents used zero‑day exploits in 2025, up from 3% the previous year. (DeepStrike 2025 Vulnerability Statistics)
- Human‑element involvement remains high but stable; the DBIR reports that 68% of breaches involve human error, consistent with prior years. (Verizon 2024 Data Breach Investigations Report)
- Cloud‑storage public exposure improved: public S3 buckets declined from 1.5% in 2023 to 1% in 2025, and Azure Blob public exposure dropped from 2.6% to 1.3%. (Datadog)
- Enforcement of IMDSv2 improved: enforcement on EC2 instances increased from 21% two years ago to 49% in 2025. (Datadog)
- Unpatched web services remain widespread; 82% of organizations have at least one unpatched service, and the percentage hasn’t improved year over year. (Orca’s 2025 State of Cloud Security Report)
- CVE volume continues to climb: more than 21,500 vulnerabilities were disclosed in the first half of 2025, representing an 18% increase over the same period in 2024 and trending toward 50,000 CVEs by year’s end. (DeepStrike 2025 Vulnerability Statistics)
- Global average breach costs fell 9% from 2024 to 2025, but U.S. costs rose 9%, showing regional divergence. (IBM Cost of a Data Breach 2025 summary)
- Industry impact improvements are uneven; healthcare breach costs fell from $9.77 million to $7.42 million, but many sectors still see rising costs. (IBM Cost of a Data Breach 2025 summary)
Cloud Security Market Growth and Spending Outlook
Recent security statistics highlight just how fast the cloud security market is expanding. Fortune Business Insights values it at $37.87 B in 2023 and projects $156.25 B by 2032.
Much of this growth stems from companies migrating workloads to public cloud infrastructure and adopting cloud‑based services. Organizations worldwide are boosting cloud security investments to cope with the growing security challenges.
As per the report, North America held 39.32 % of the market, and budgets continue to increase cloud security investments as breaches and service disruptions mount.
About 33 % of companies now prioritise cloud‑security spending, and 86 % report losses over $500k due to account hijacking, underscoring the need for sustained investment.
AI, Zero‑Trust and Emerging Cloud Security Strategies
AI and zero‑trust architectures are reshaping cloud security. Around 84 % of organizations use AI services, yet most cloud assets sit unmonitored, leaving cloud environments vulnerable to misconfigurations and cyber threats. Many recent cloud data breaches have happened from cloud misconfigurations and poorly protected cloud resources.
Meanwhile, zero‑trust adoption is surging: 81 % have implemented it fully or partially, and 84 % pursue it specifically for cloud security. Leaders expect AI and zero‑trust cloud security solutions to enhance data protection, but 49 % struggle to govern policies across multi-cloud environments. However, cloud governance and cloud migration remain ongoing challenges.
Closing Thoughts: Building Resilience in the Cloud
These cloud security statistics underscore that complacency invites cloud environment breaches. Whether it’s a high‑profile cloud security breach or a minor incident, cloud security failures can be avoided. Emerging cloud technologies reduce complexity and help protect data consistently across hybrid architectures.
However, government agencies and private organizations alike must embrace them. With disciplined training, incident readiness, and continuous improvement, the cloud can become a strategic advantage instead of a security concern.
FAQs
Misconfigurations remain the leading cloud security threat. About 23 % of cloud incidents arise from misconfigured settings, and 82 % of those errors are human‑induced. Attackers also exploit unpatched vulnerabilities (33 %), steal credentials (16 %), and use phishing (14 %). Effective cloud security posture management and strong access management help mitigate these threats.
In 2023, 82 % of data breaches involved information stored in cloud environments. This underscores how much cloud data is at stake and the need to secure sensitive cloud data.
Surveys show 83 % of organizations suffered a cloud security incident in the past 18 months. Another study found 80 % of companies experienced a serious cloud security breach in 2023. (source)
IBM reports the average global cost of a cloud security breach is $4.44 million; in the U.S., it increases to $10.22 million. Such costs reflect damage to trust, regulatory penalties, and remediation of compromised cloud infrastructure.
Around 23 % of cloud security incidents result from misconfigurations, and 82 % of those misconfigurations are caused by human error. Human mistakes drive the vast majority of cloud failures, highlighting the need for disciplined access management. (source)
More than half (55 %) of organizations use at least two cloud providers, and less than 1 % rely on a single cloud. Multi cloud environments are now standard for redundancy and flexibility.
Yes. Over half (56 %) of organizations struggle to secure data across multi cloud environments, and 69 % find it difficult to maintain consistent control. Robust cloud security posture management is essential to unify policies.
About 32 % of cloud assets remain unpatched for more than 180 days, each averaging 115 known vulnerabilities. Further, 82 % of organizations have at least one unpatched web service, and 58 % have vulnerabilities older than 20 years, risking sensitive cloud data. (source)
A survey found 86 % of IT leaders incurred losses exceeding $500 000 from cloud account hijacking. Such attacks often precede larger cloud security breaches and highlight weak access management.
In the first half of 2025, more than 21,000 vulnerabilities were disclosed worldwide; an 18 % year‑over‑year increase. About 38 % were rated high or critical (1,773 critical and 6,521 high‑severity issues), underscoring the strain on cloud service patching.
Healthcare breaches cost an average of $7.42 million, financial services $5.90 million, and energy $5.04 million. These sectors handle high‑value cloud data and face strict compliance mandates.
Mandiant reports that attackers most often do the following:
-exploit vulnerabilities (33 %),
-use stolen credentials (16 %), or
-launch phishing campaigns (14 %). (source)
Meanwhile, phishing remains widespread, affecting 73 % of organizations across modern cloud environments.
Yes. Roughly 71 % of organizations report a shortage of skilled cloud‑security professionals, and 77 % cite inadequate training and collaboration as major challenges. This talent gap impacts the cloud security market.
Federated sign‑in is gaining ground: 79 % of organizations use identity federation for AWS console access, yet 39 % still use dedicated IAM users, and 20 % rely exclusively on IAM users. Strong access management remains vital.
Only about 1 % of Amazon S3 buckets remain effectively public, down from 1.5 % in 2023/2024. Public access blocks now protect 83 % of buckets. (source) In Azure, roughly 1.3 % of Blob containers are public, and 58 % proactively block access- a reminder that cloud service providers play a role.
The “4 Cs” framework stands for Cloud, Cluster, Container, and Code. It urges organizations to secure each layer: the cloud infrastructure itself, orchestration clusters, containerized workloads, and application code.
In Q1 2025, organizations faced roughly 1,925 cloud attacks per week; about 275 per day. During the same quarter, there were over 2,200 ransomware incidents, and cloud intrusion attempts jumped 75 % from 2022 to 2023. These security statistics reflect relentless threat pressure. (source)
High‑profile incidents include the 2024 Change Healthcare attack, which exposed over 100 million patient records, and the Ticketmaster breach, which compromised about 40 million users. Earlier examples include Capital One’s 2019 cloud security breach, which affected 106 million customers due to a misconfigured firewall.
Key 2025 insights include:
-82 % of data breaches involve cloud data
-83 % of organizations experienced a cloud breach within 18 months
-55 % use multiple cloud providers
-32 % of assets remain unpatched
-Over 21,500 vulnerabilities were disclosed in H1 2025
-84 % use AI in the cloud
The shared responsibility model divides duties between cloud service providers and customers. Providers secure physical facilities, network devices, and core infrastructure, while customers must secure their applications, data, and access controls.
Key actions include: understanding the shared responsibility model, enabling MFA and least‑privilege policies, encrypting sensitive data, patching promptly, and continuously auditing configurations. Strong access management and regular backups are essential components of a solid cloud security posture.
AI adoption is widespread; 84 % of organizations use AI services. However, 97 % of AI‑related breaches occurred at companies lacking AI access controls. The World Economic Forum notes that 47% of cyber leaders worry about adversarial AI and 72 % report rising risks. So, AI can safeguard or threaten cloud infrastructure depending on governance.
A 2025 survey found that 27 % of organizations experienced a public‑cloud security incident in the preceding year. This reflects both persistent vulnerabilities and growth in cloud service usage.
Cloud incident response differs from on‑premise approaches. Responders have no physical server access; they must collect logical snapshots and provider logs. Workloads scale rapidly, so forensic artifacts can disappear. Best practices include frequent drills, cloud‑specific threat intelligence, and collaboration with cloud service providers for continuous improvement.

Tamzid is a distinguished SEO writer with over six years of experience specializing in IT, technology, data centers, and cybersecurity. His expertise extends to hyperconverged infrastructure, where he delivers well-researched, high-ranking content that bridges technical accuracy with reader clarity. With a deep understanding of both search optimization strategies and advanced IT concepts, Tamzid produces authoritative material that engages industry professionals and decision-makers alike.